INDEPENDENCE TITLE MLS STATISTICS
OVERVIEW
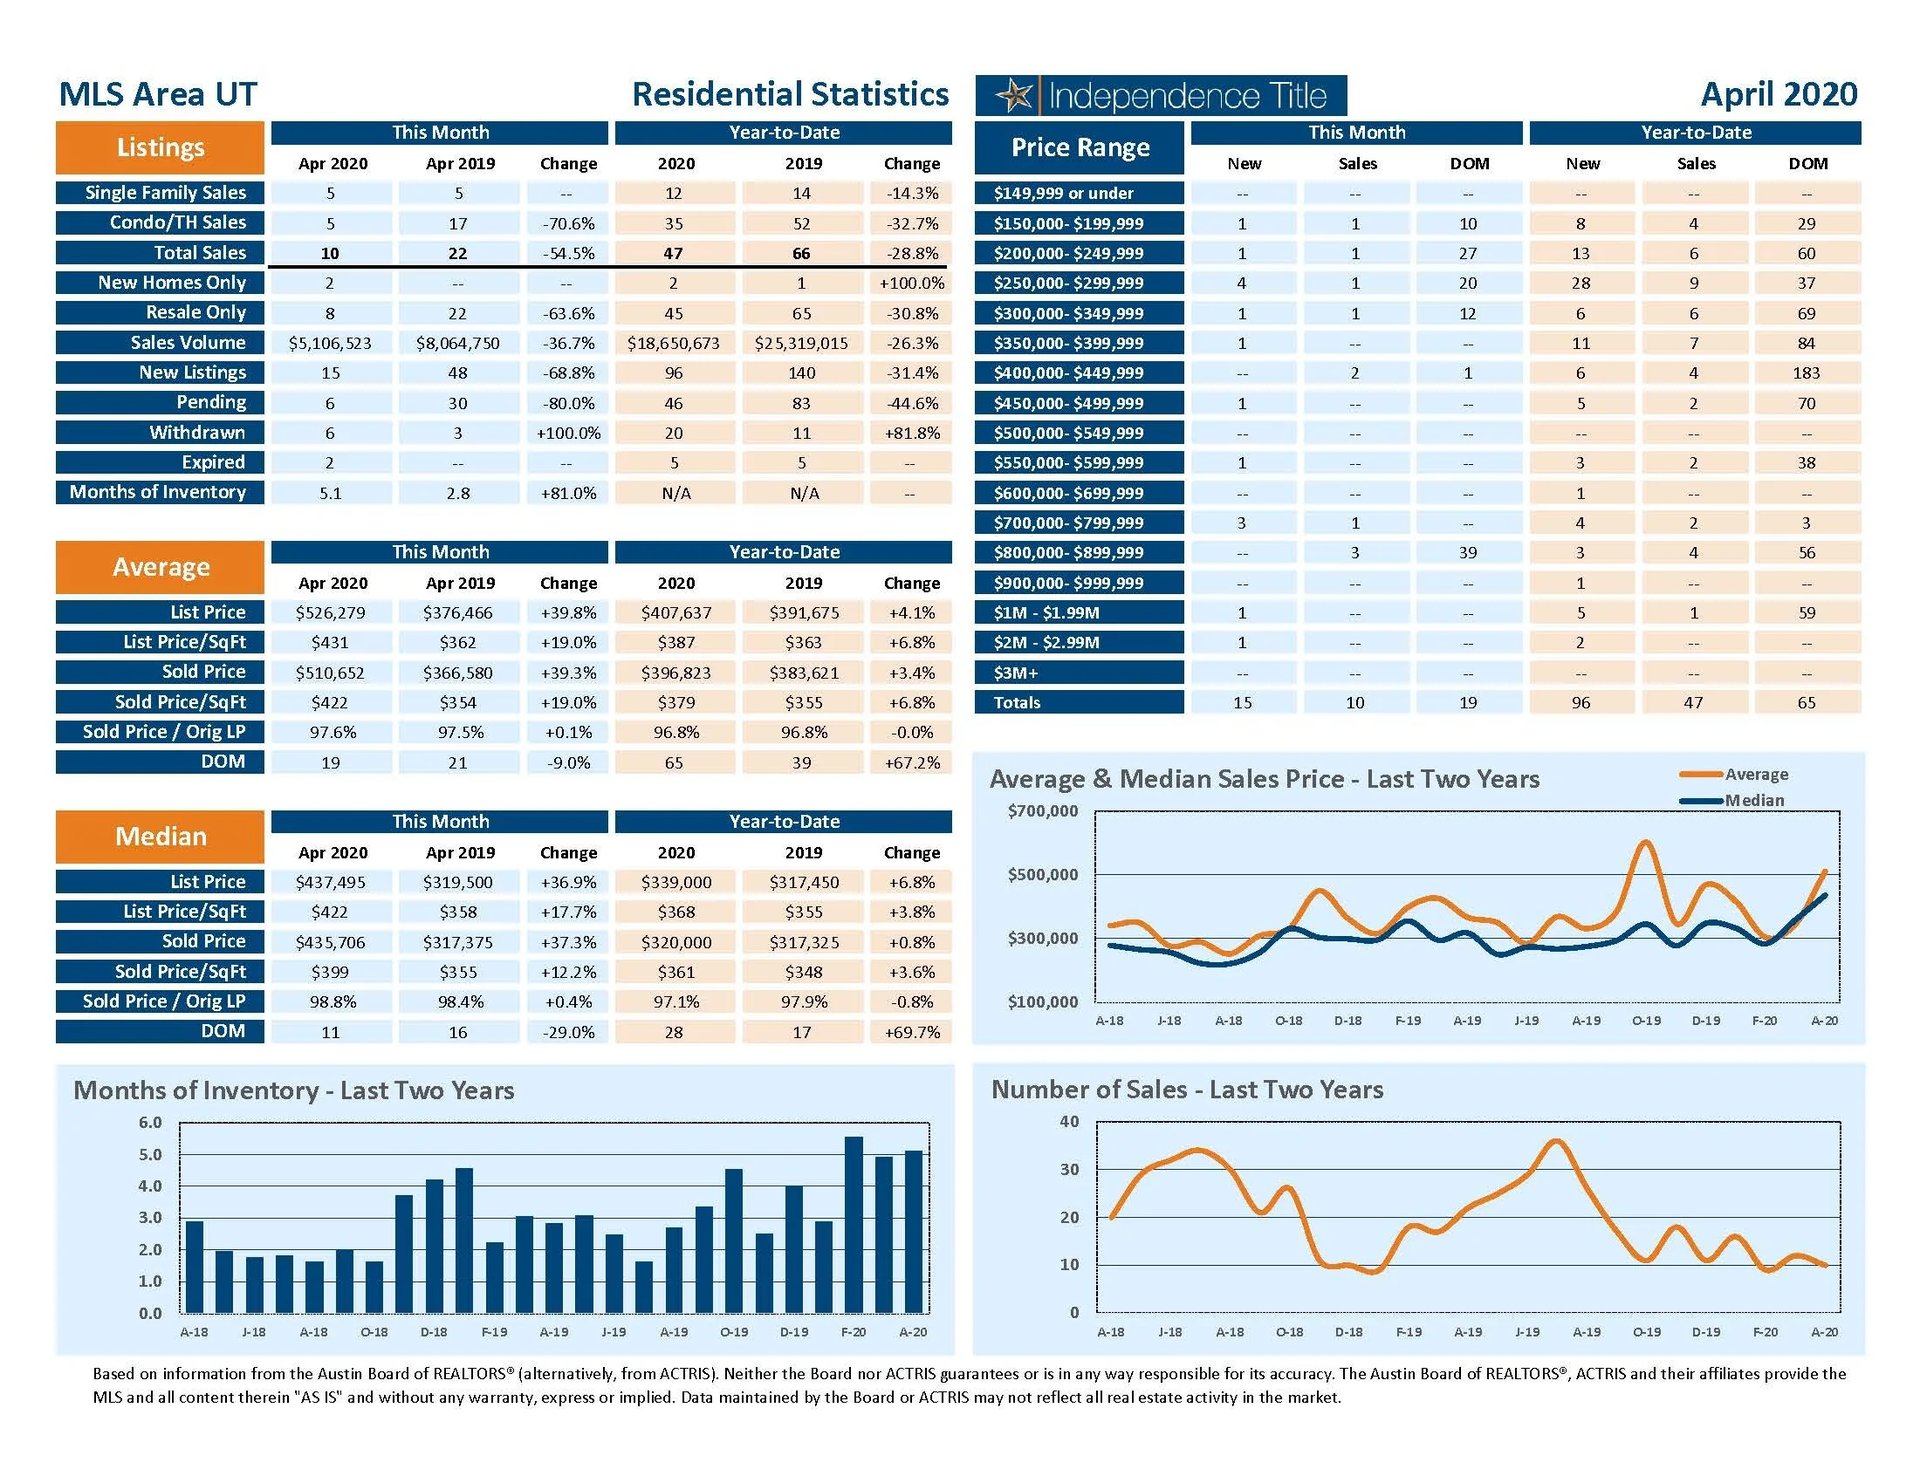
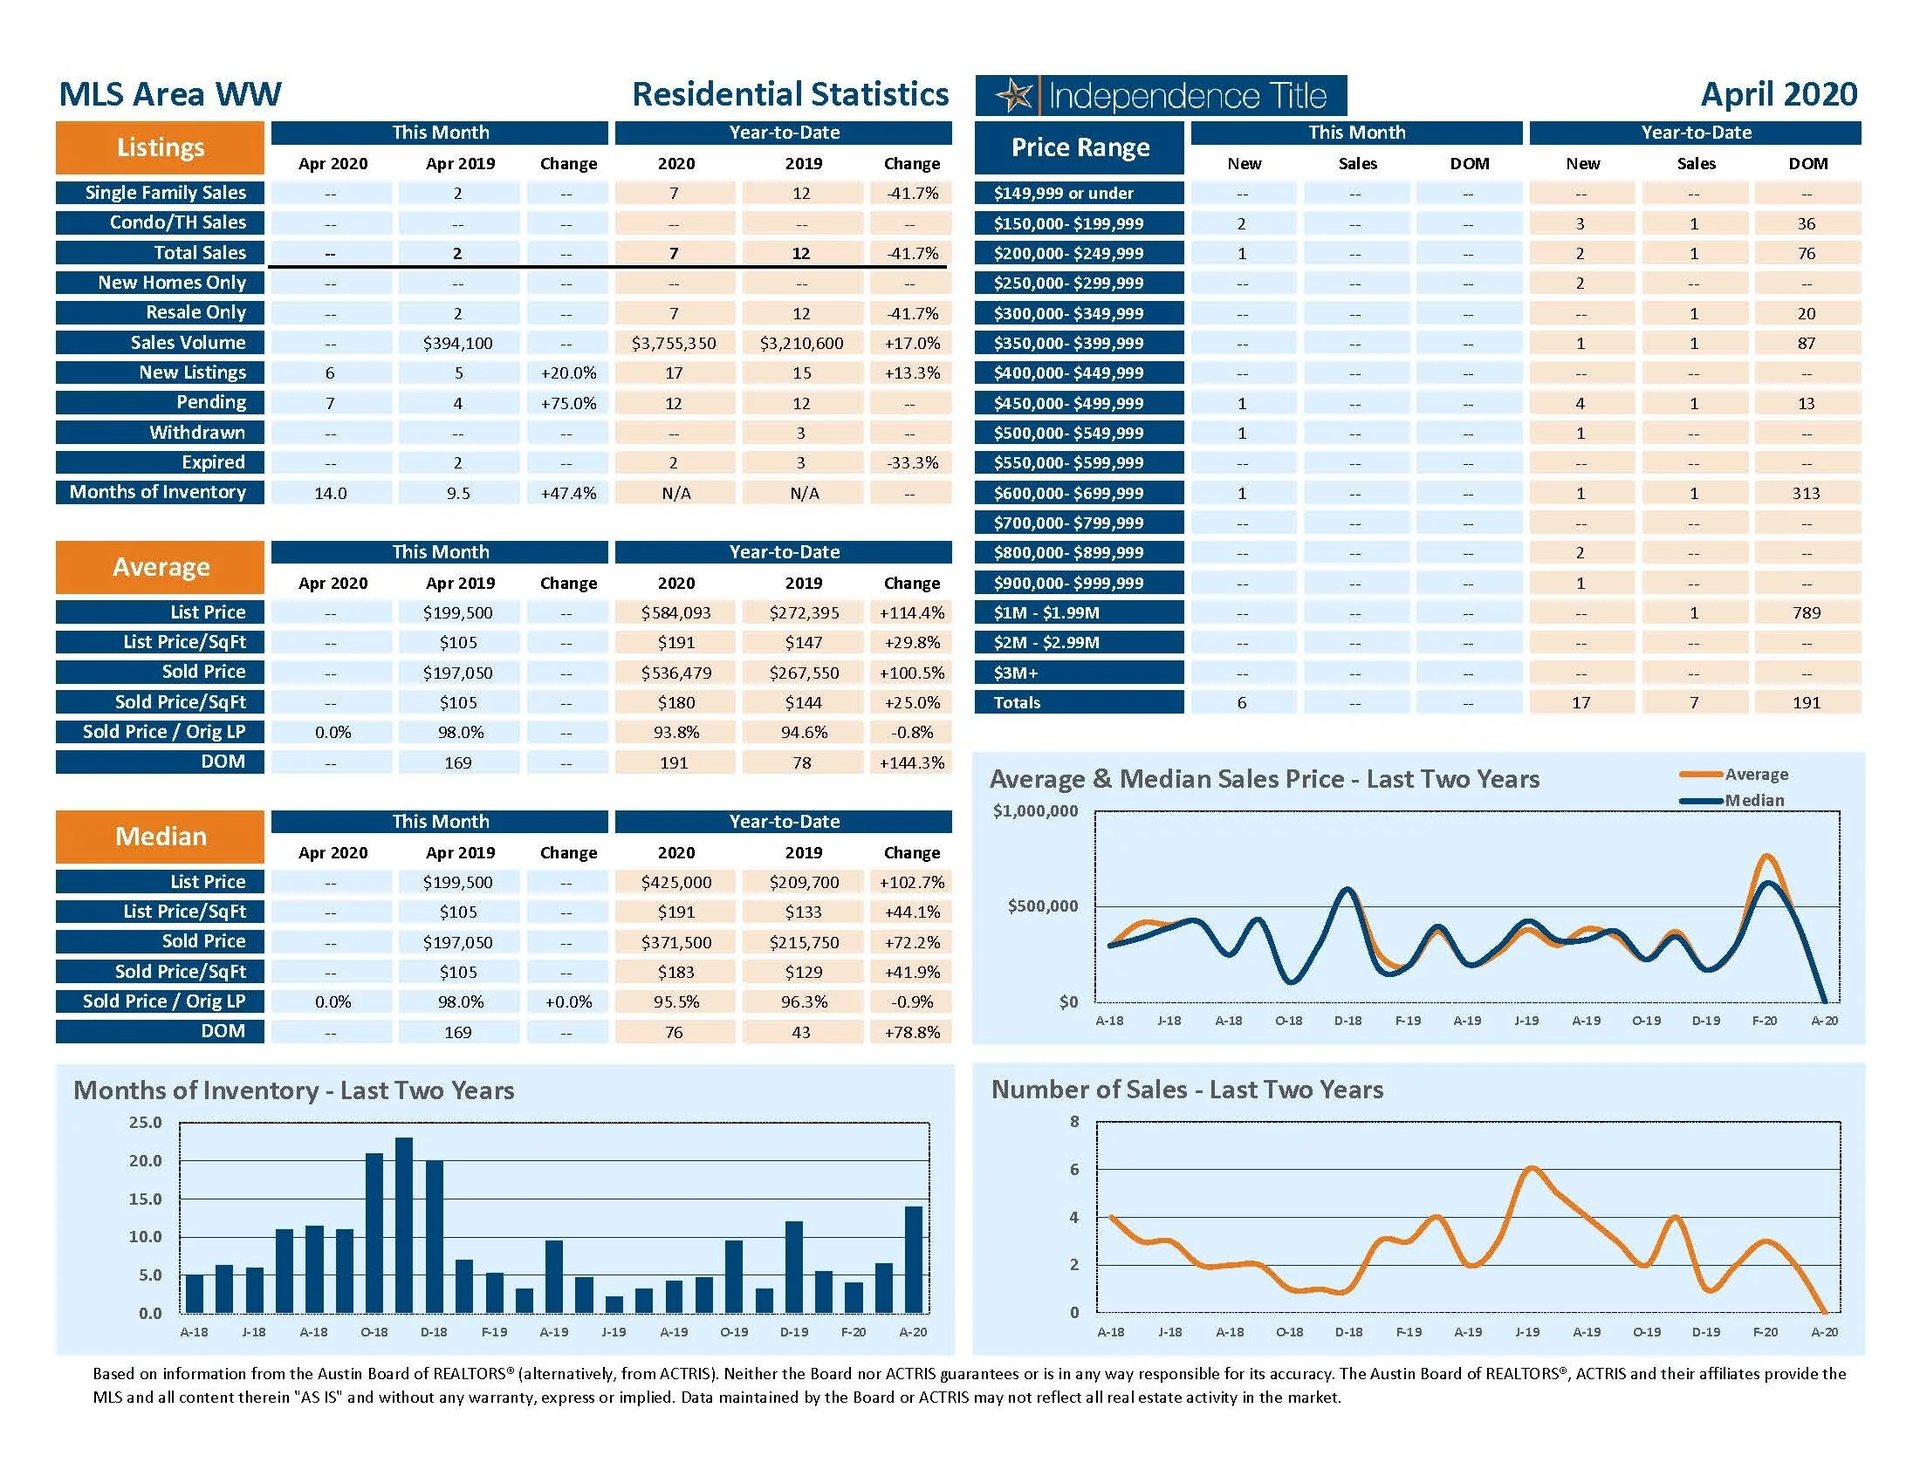
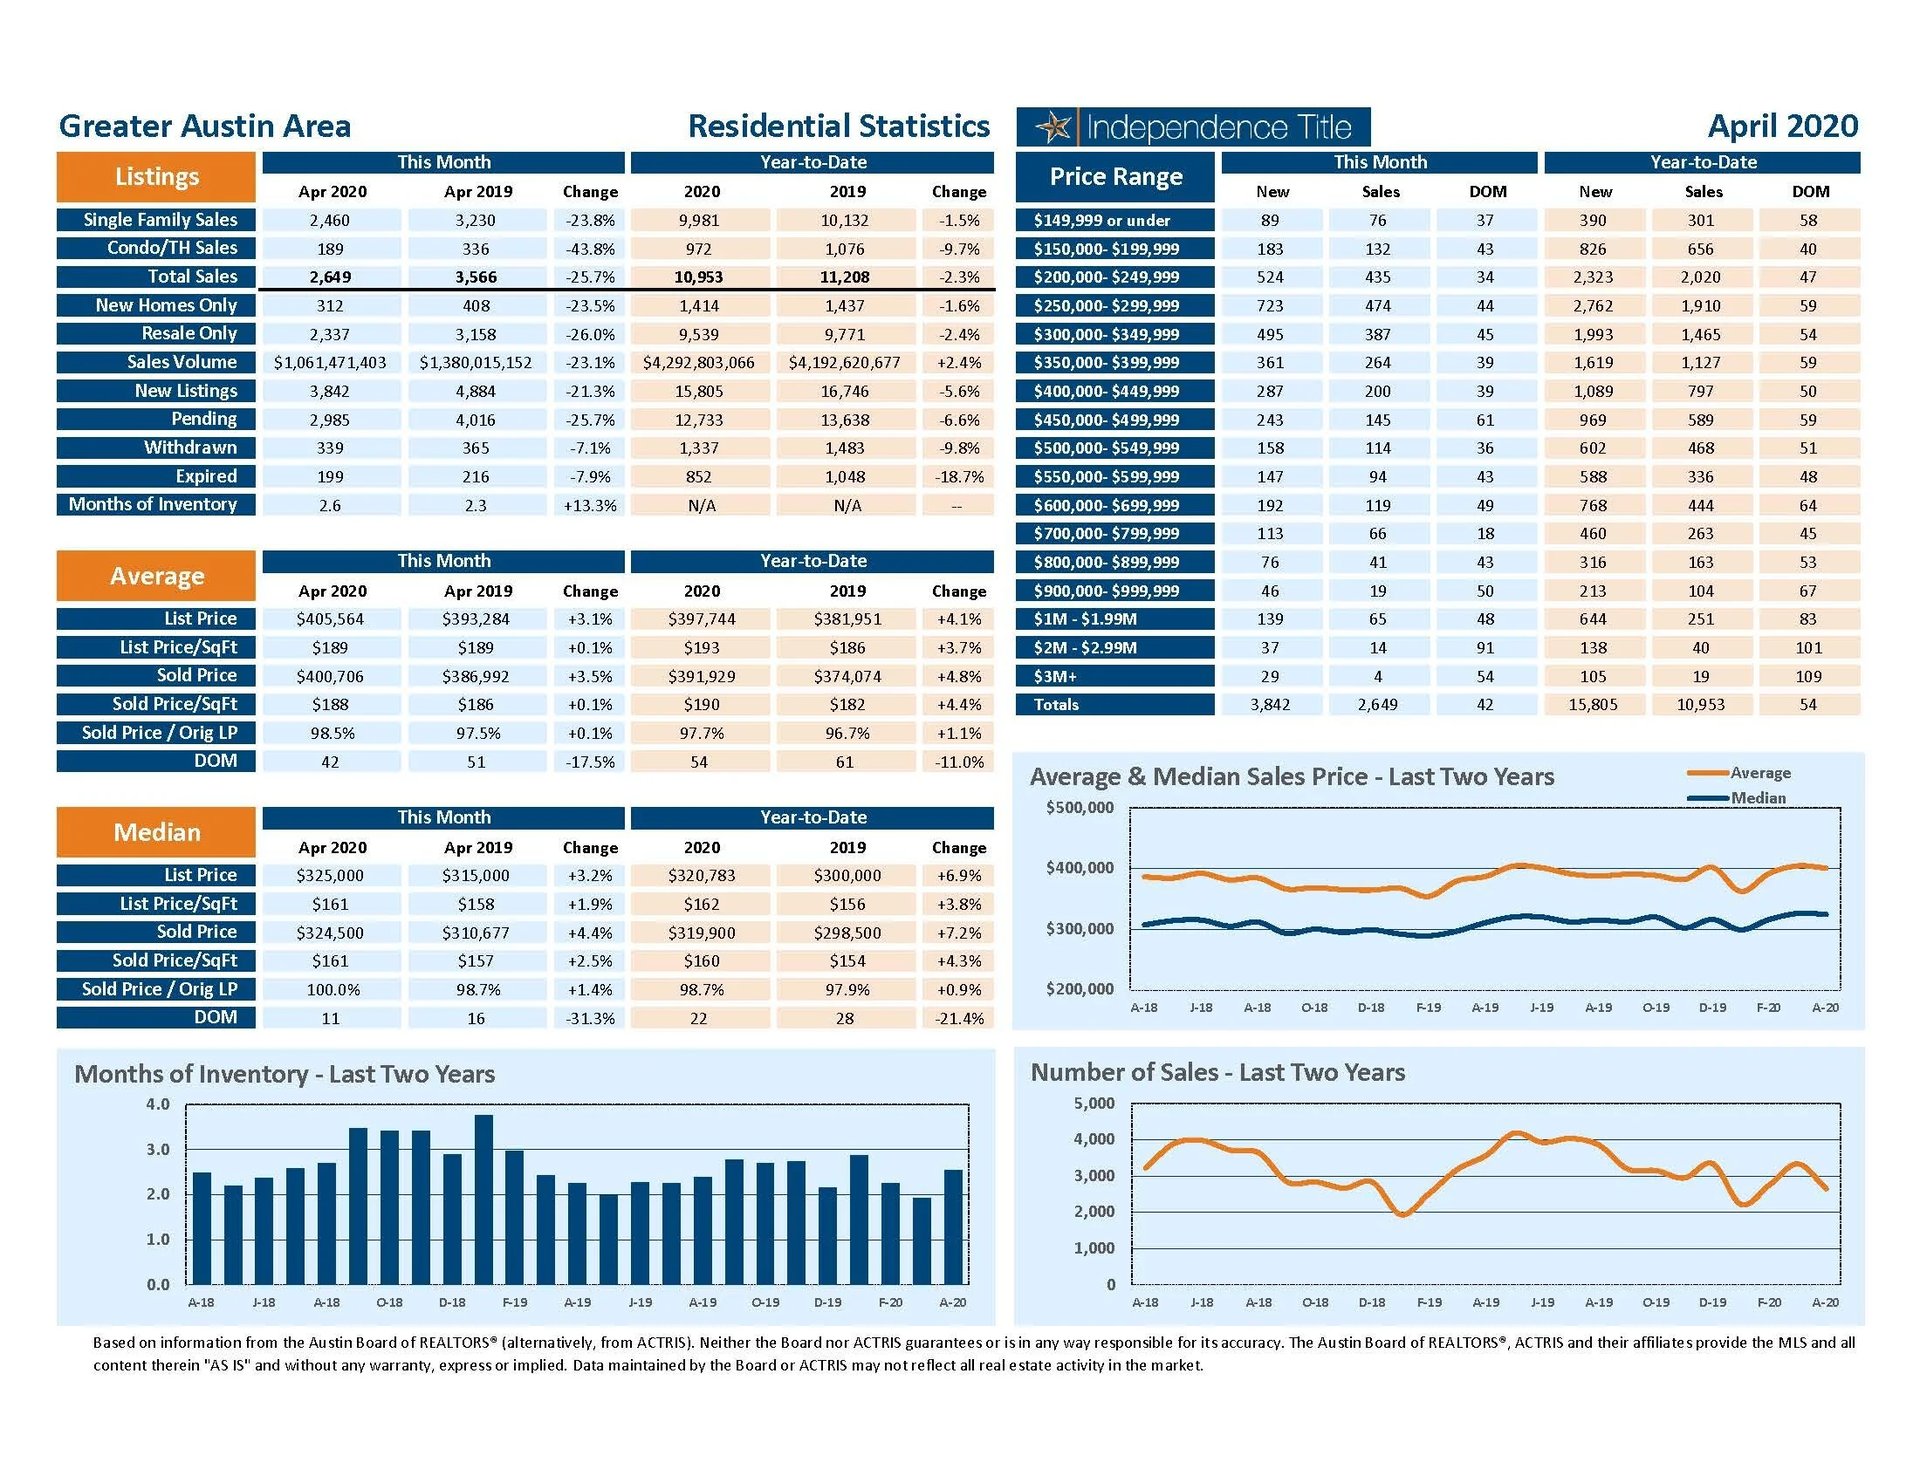
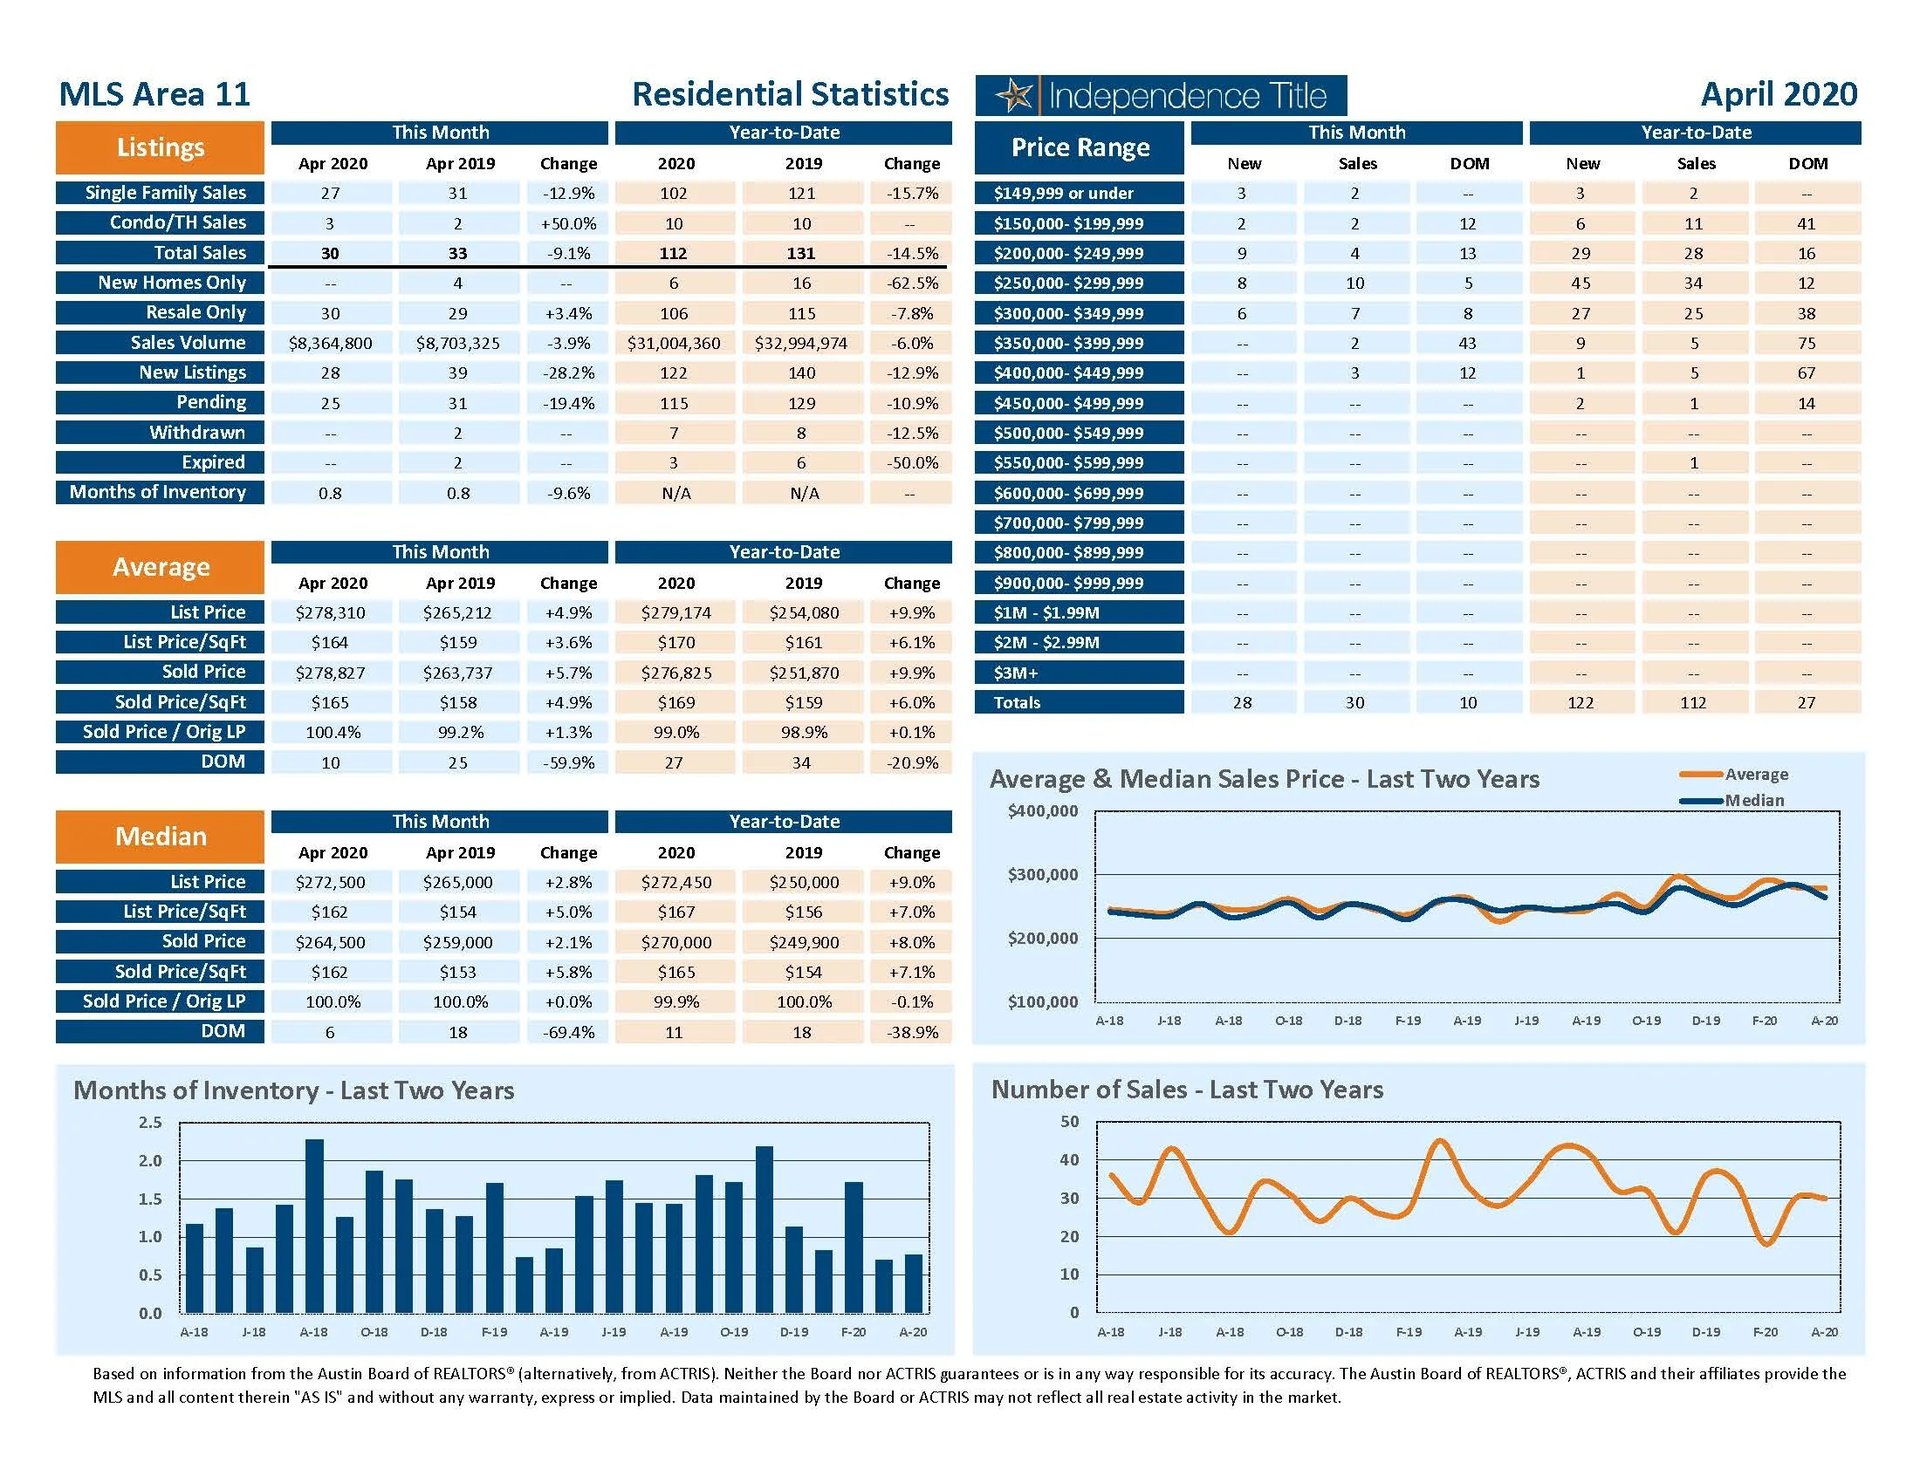
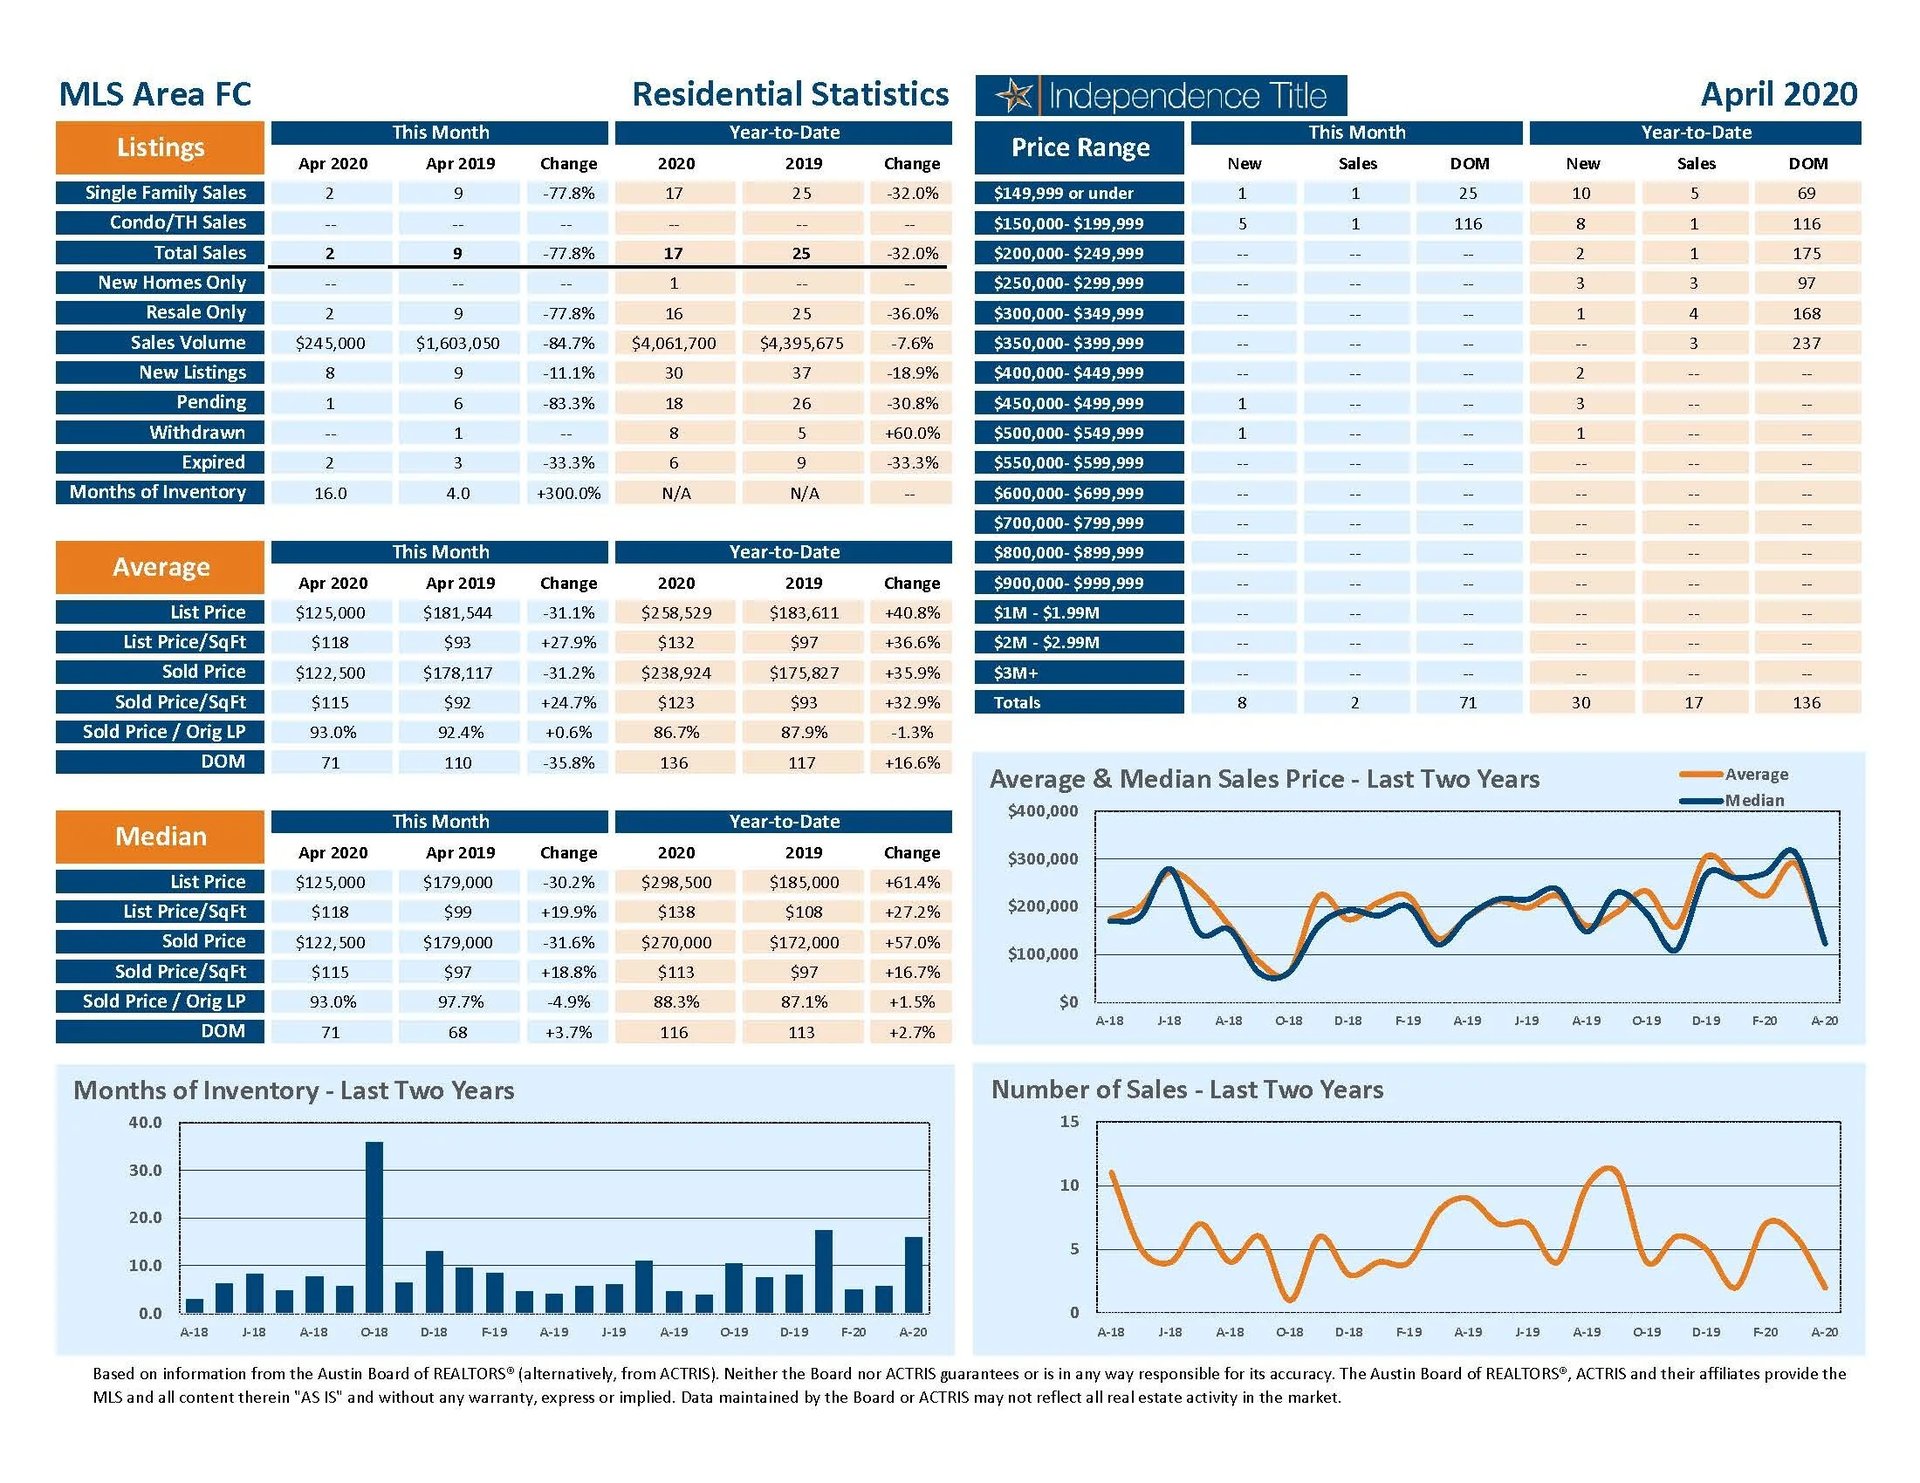
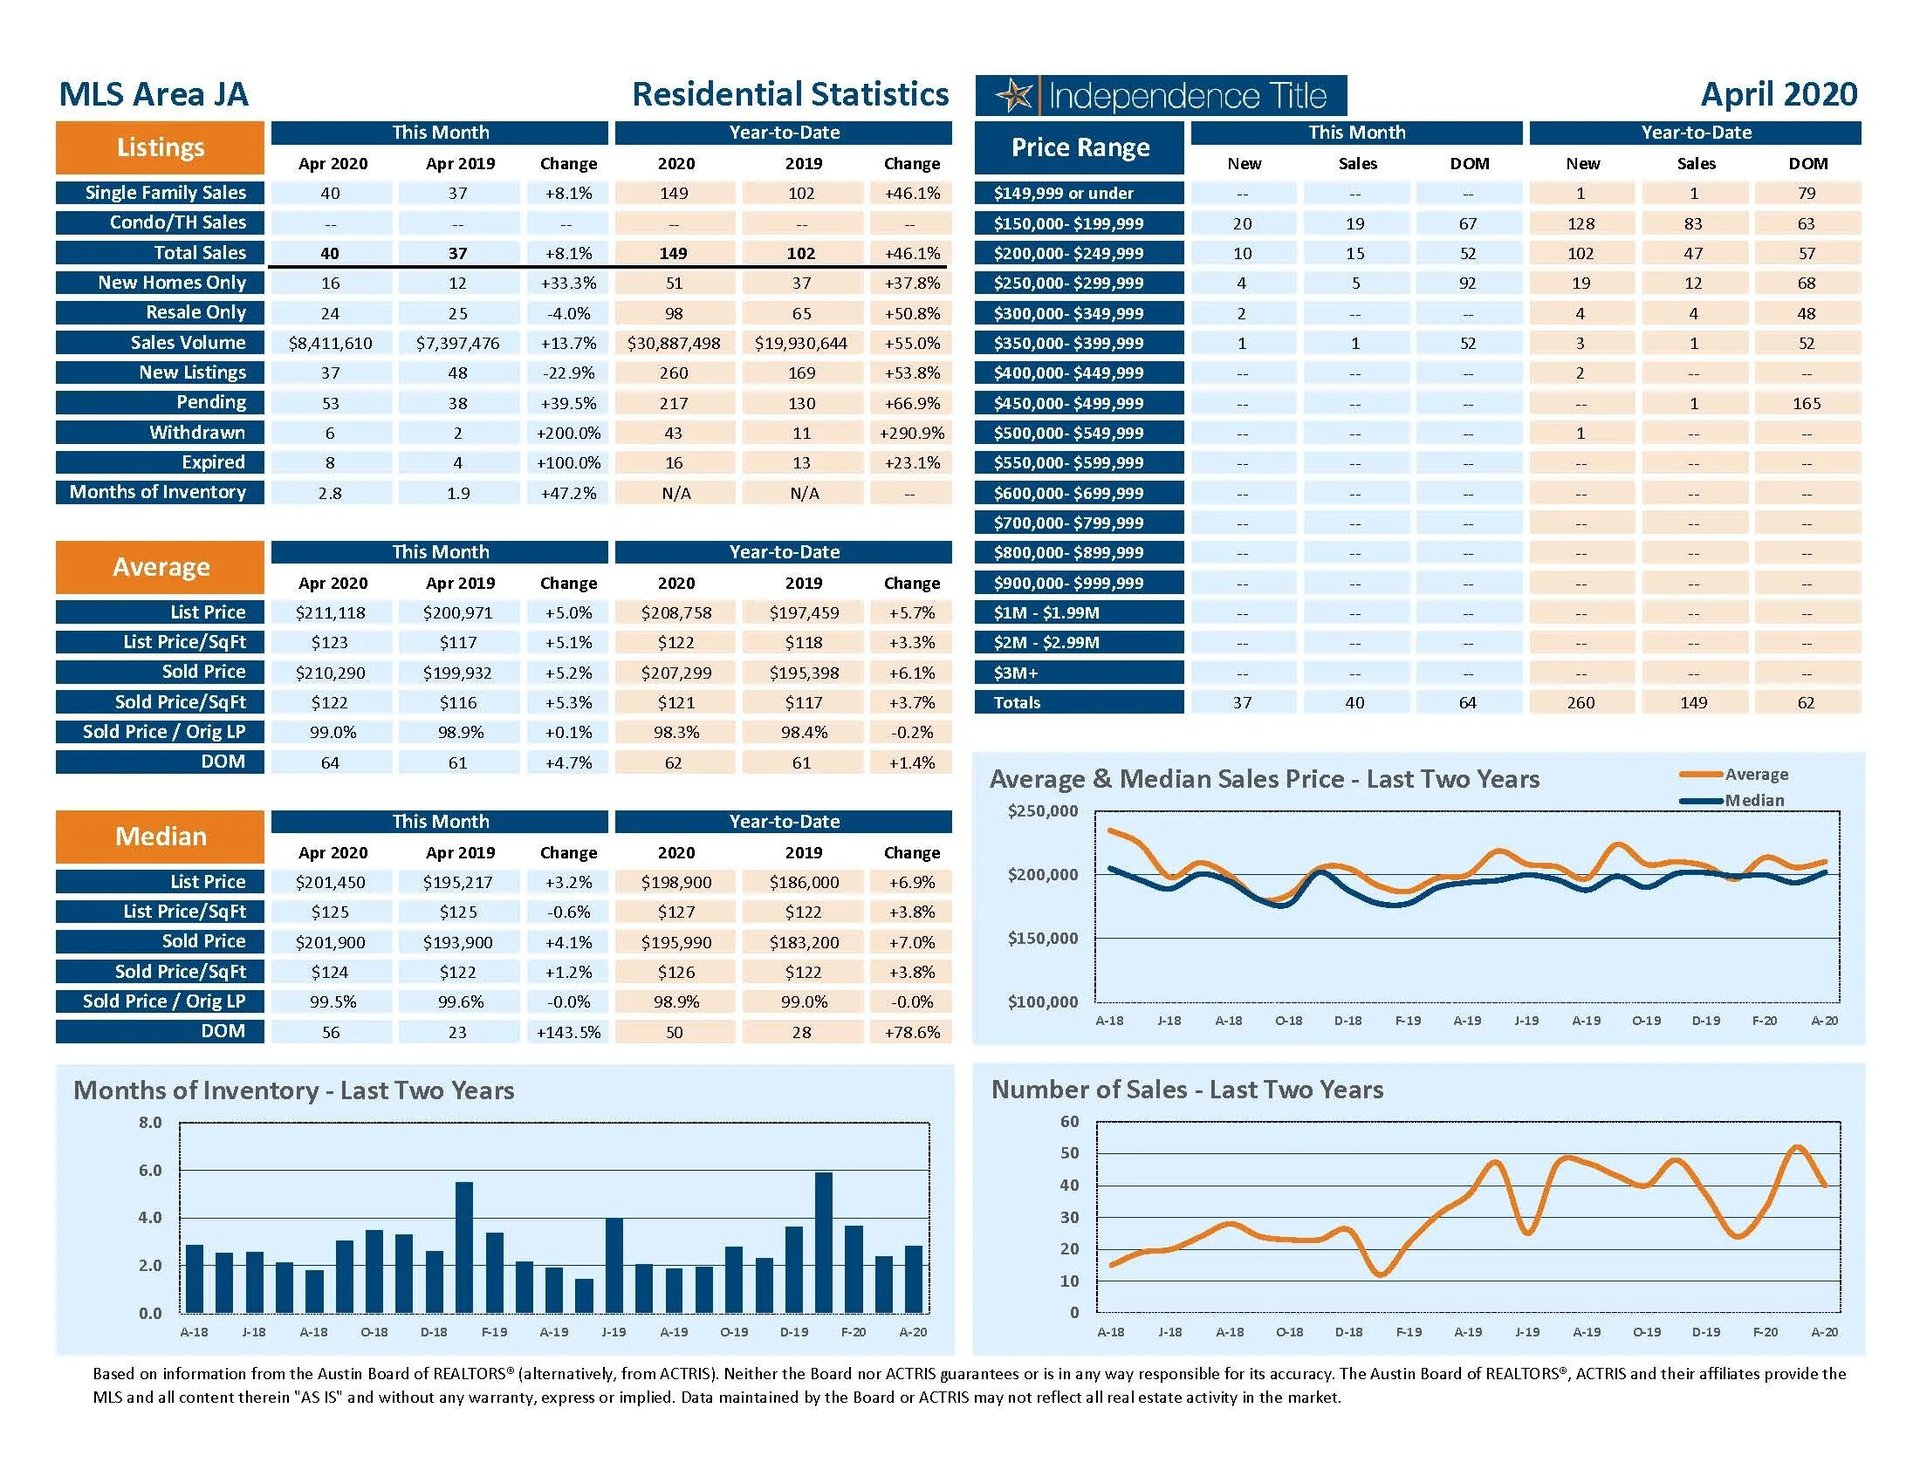
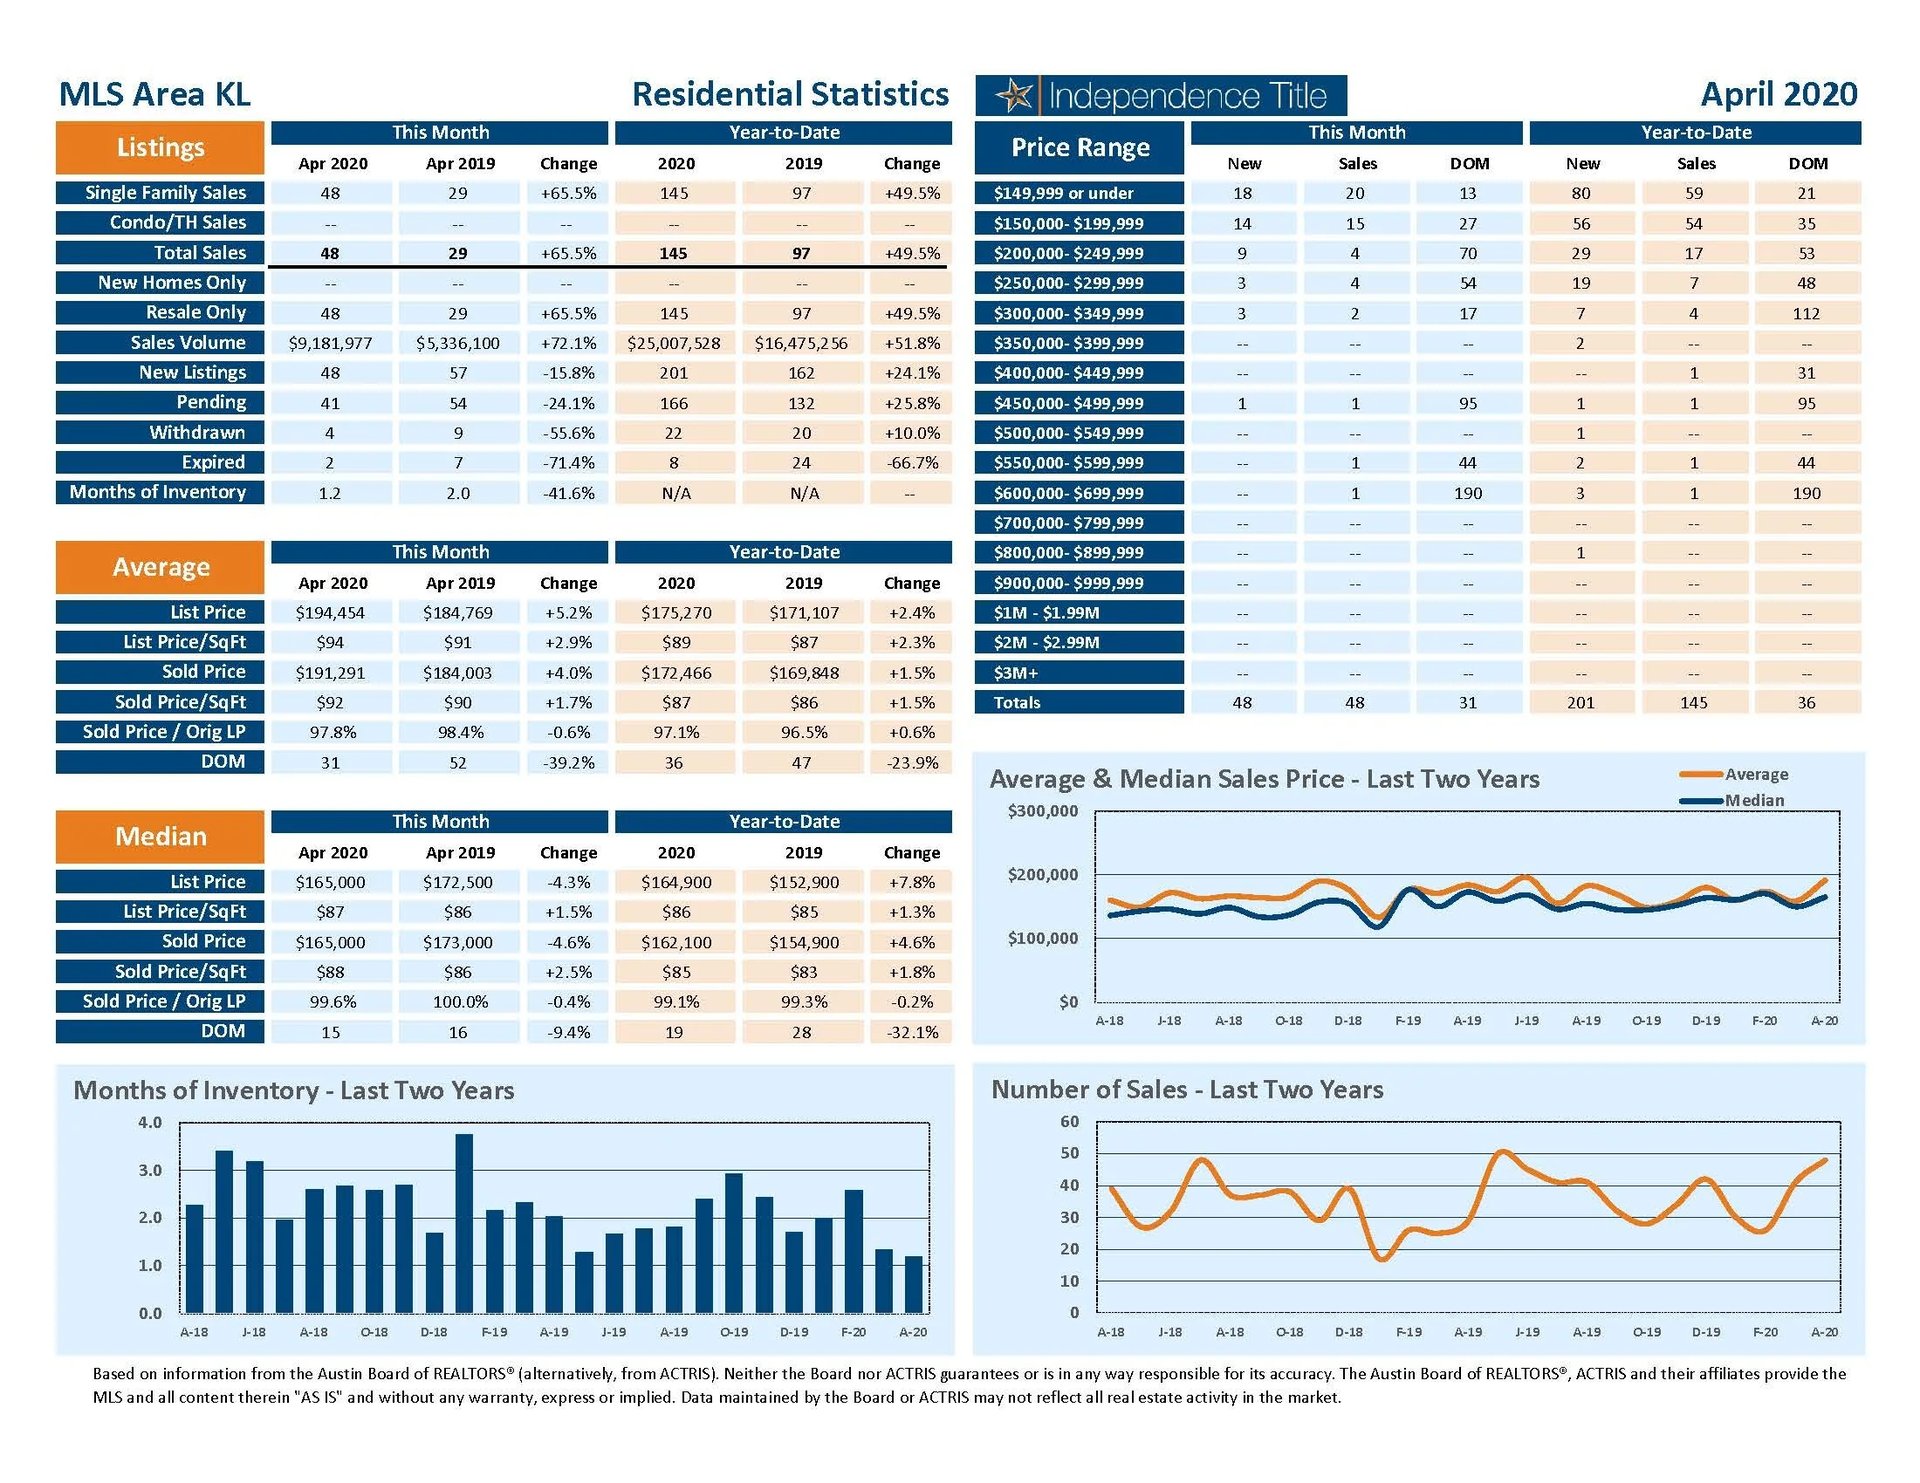
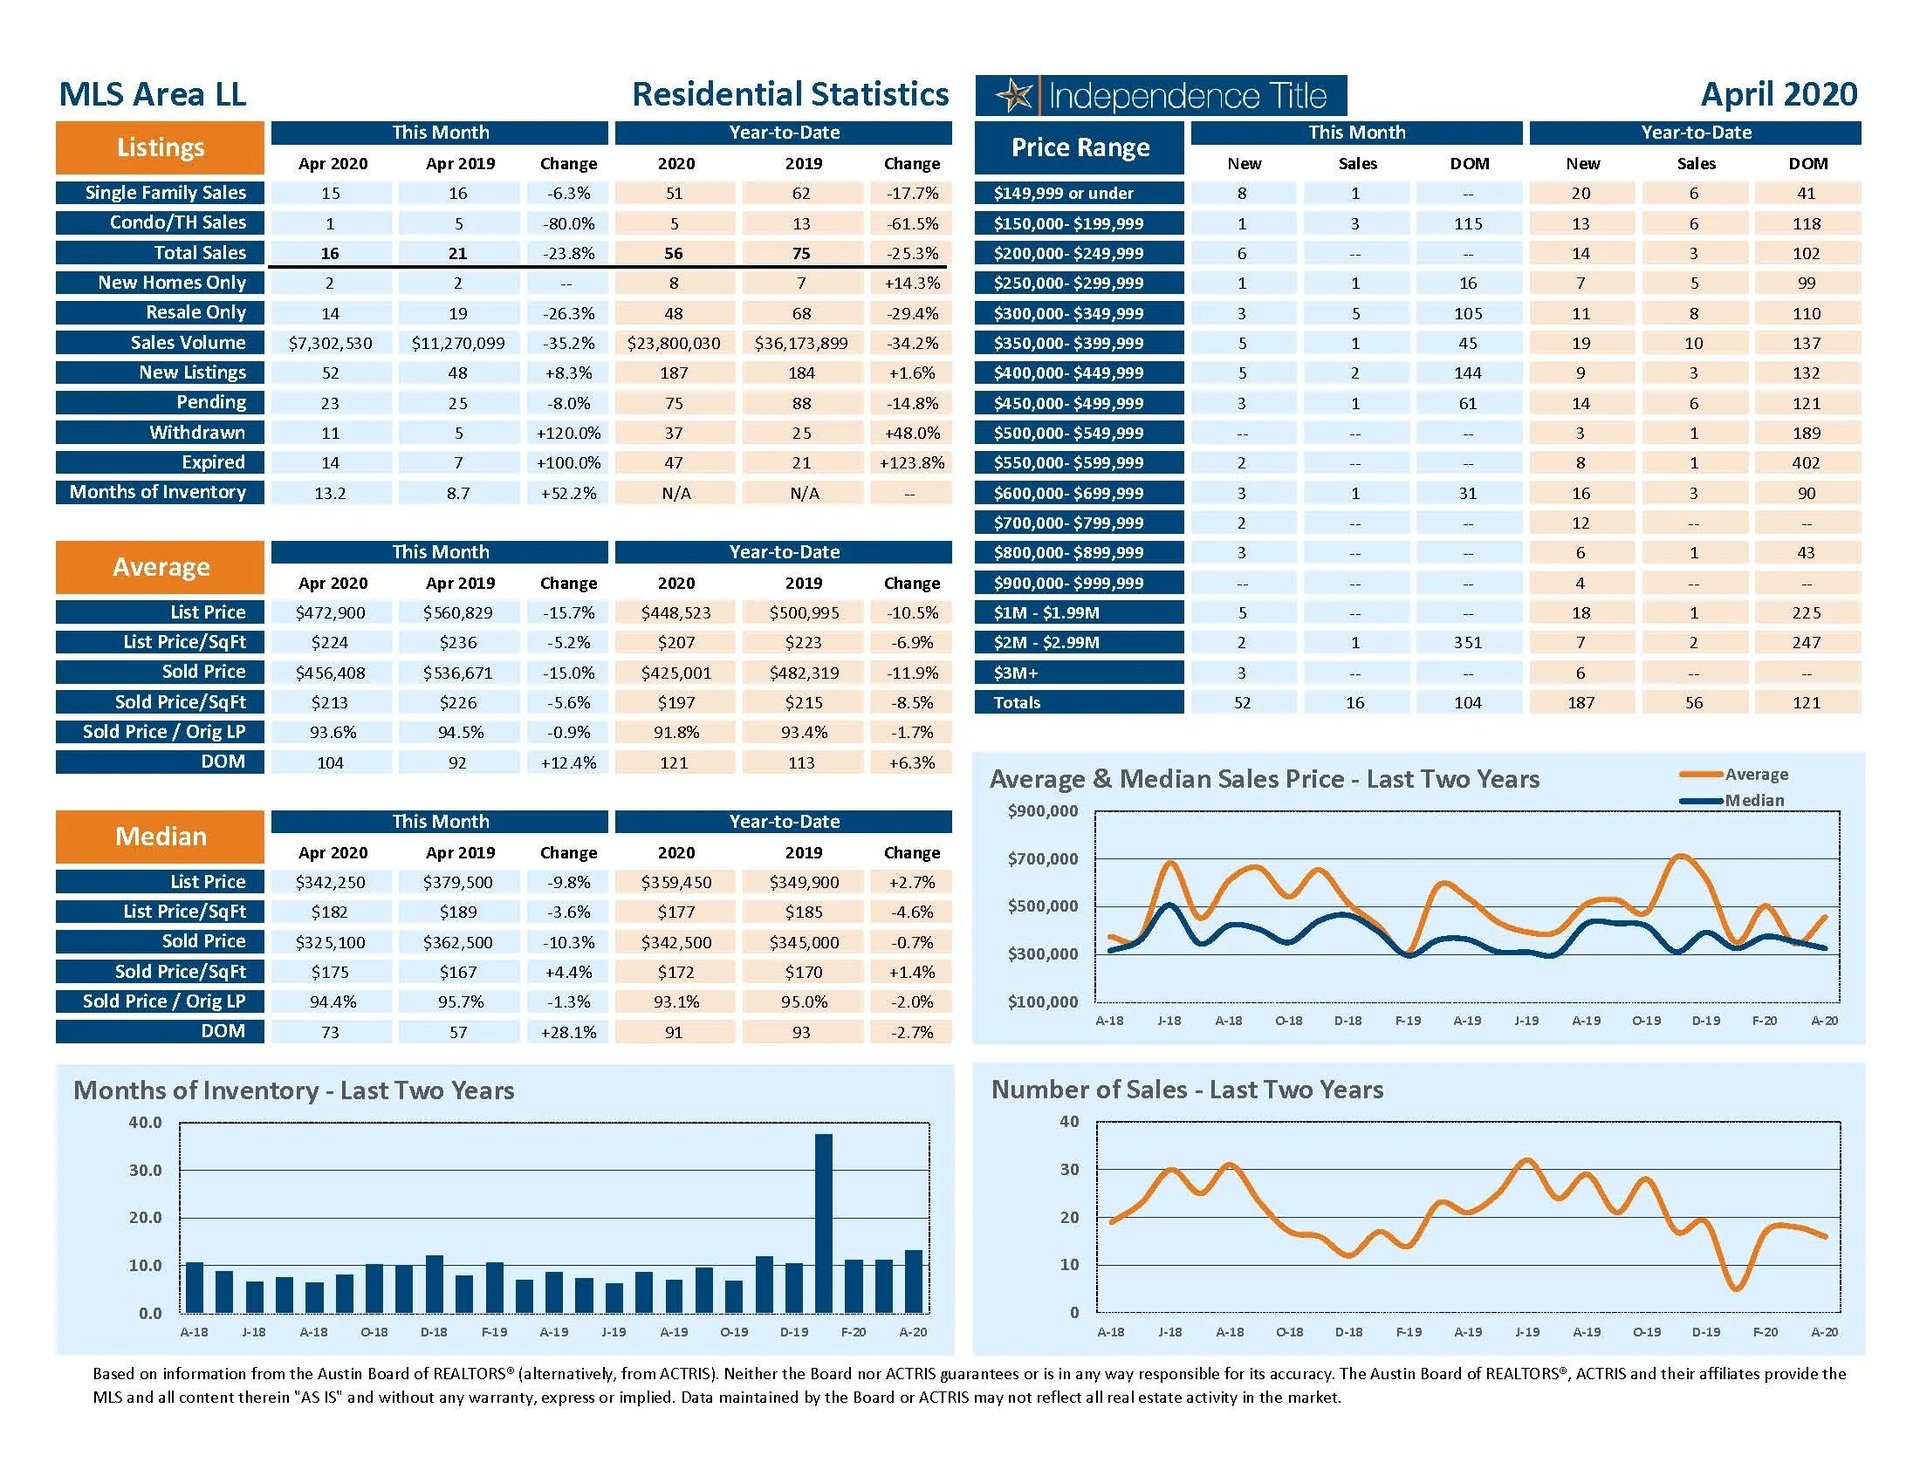
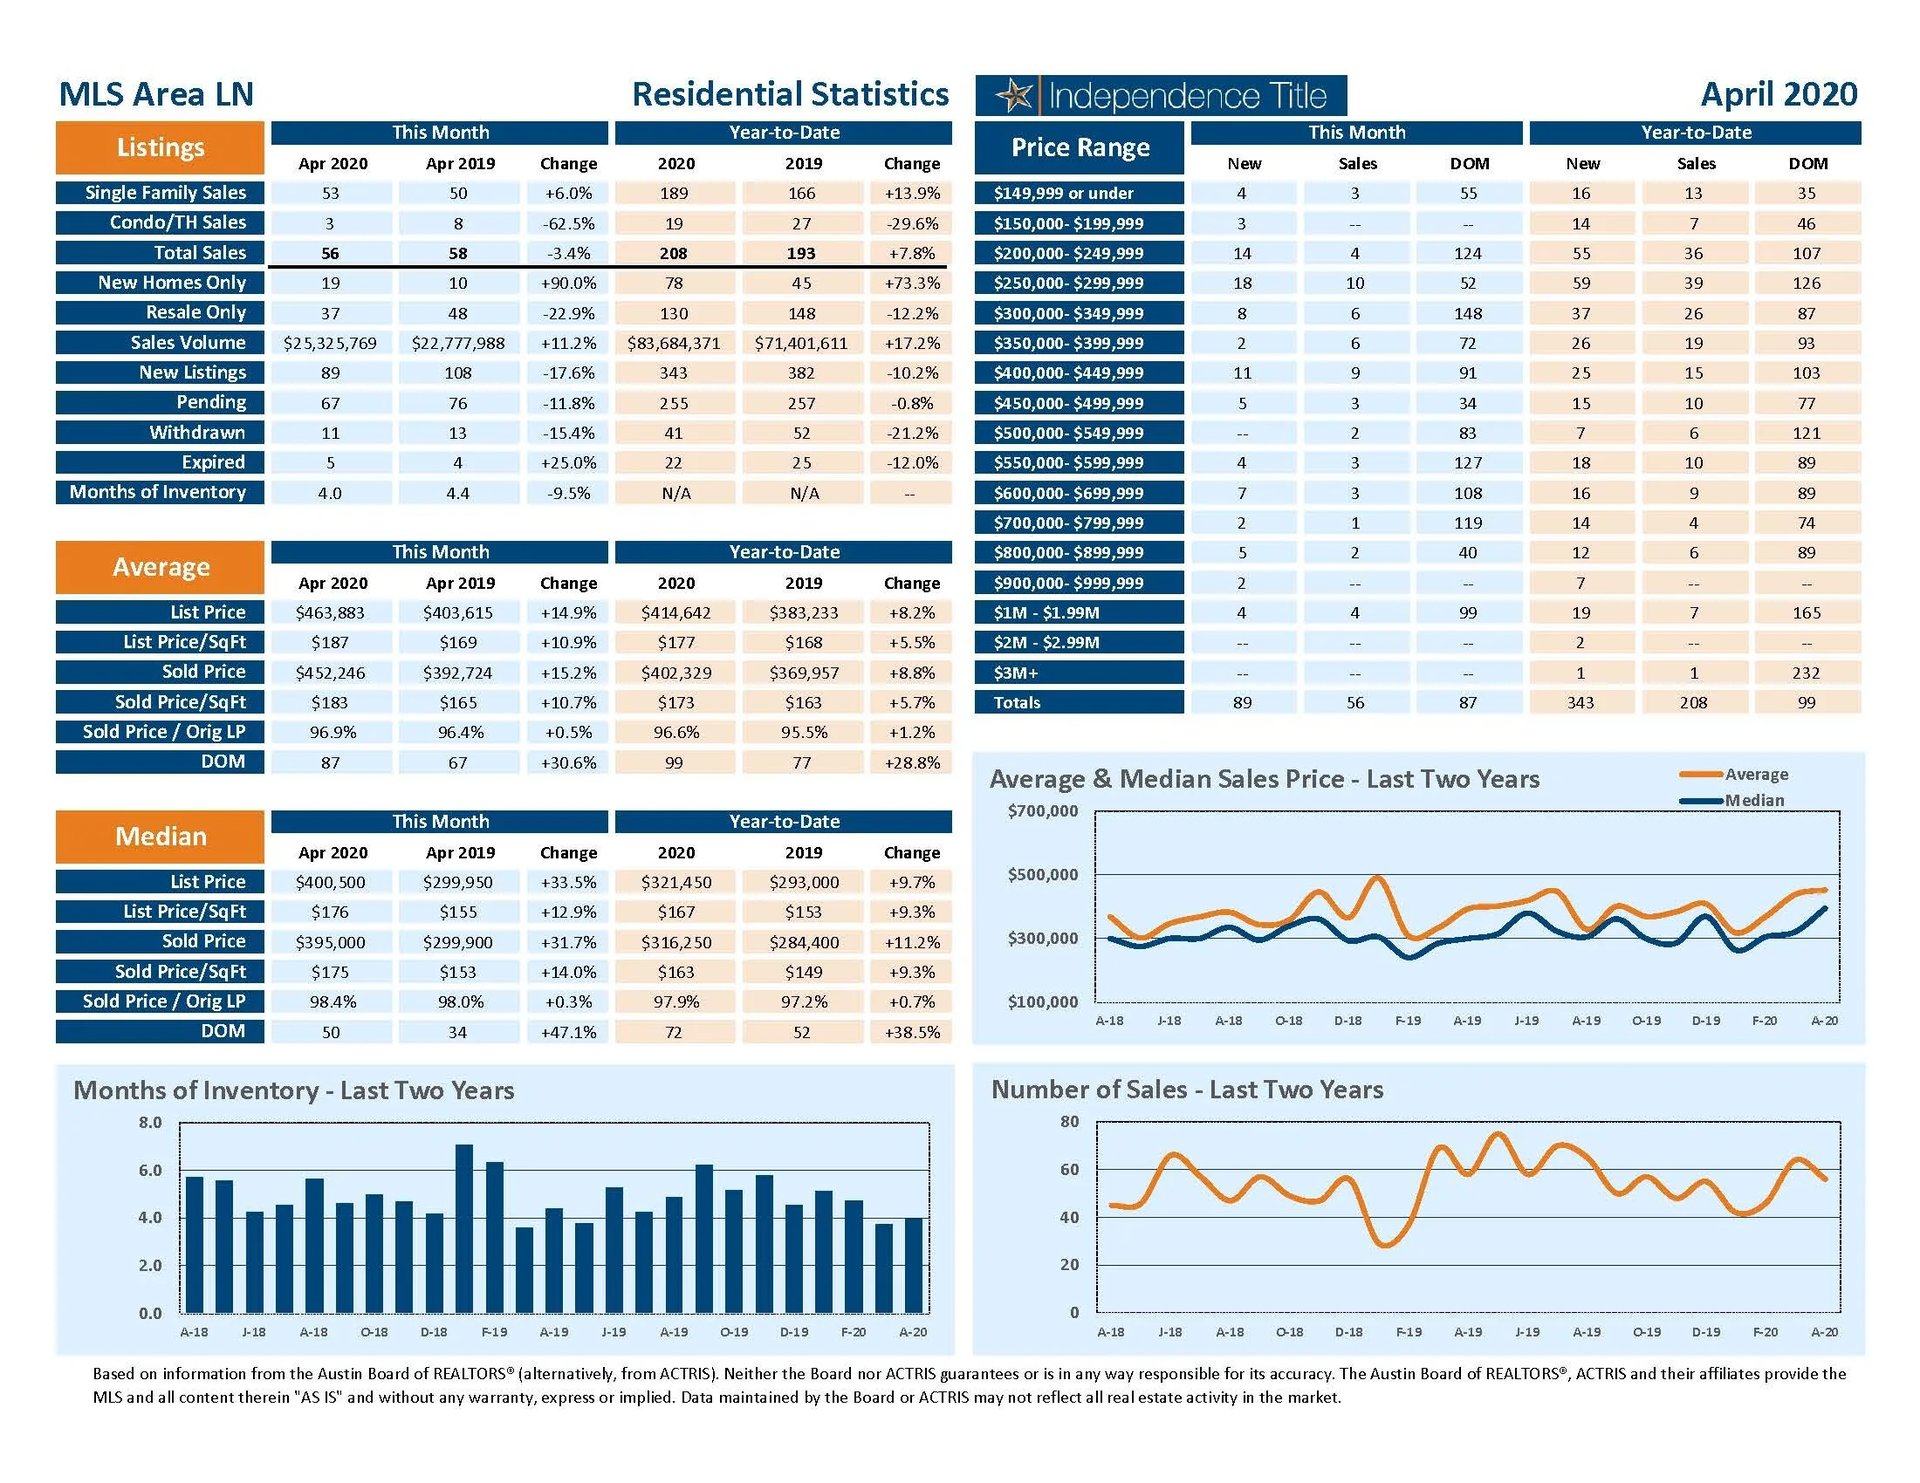
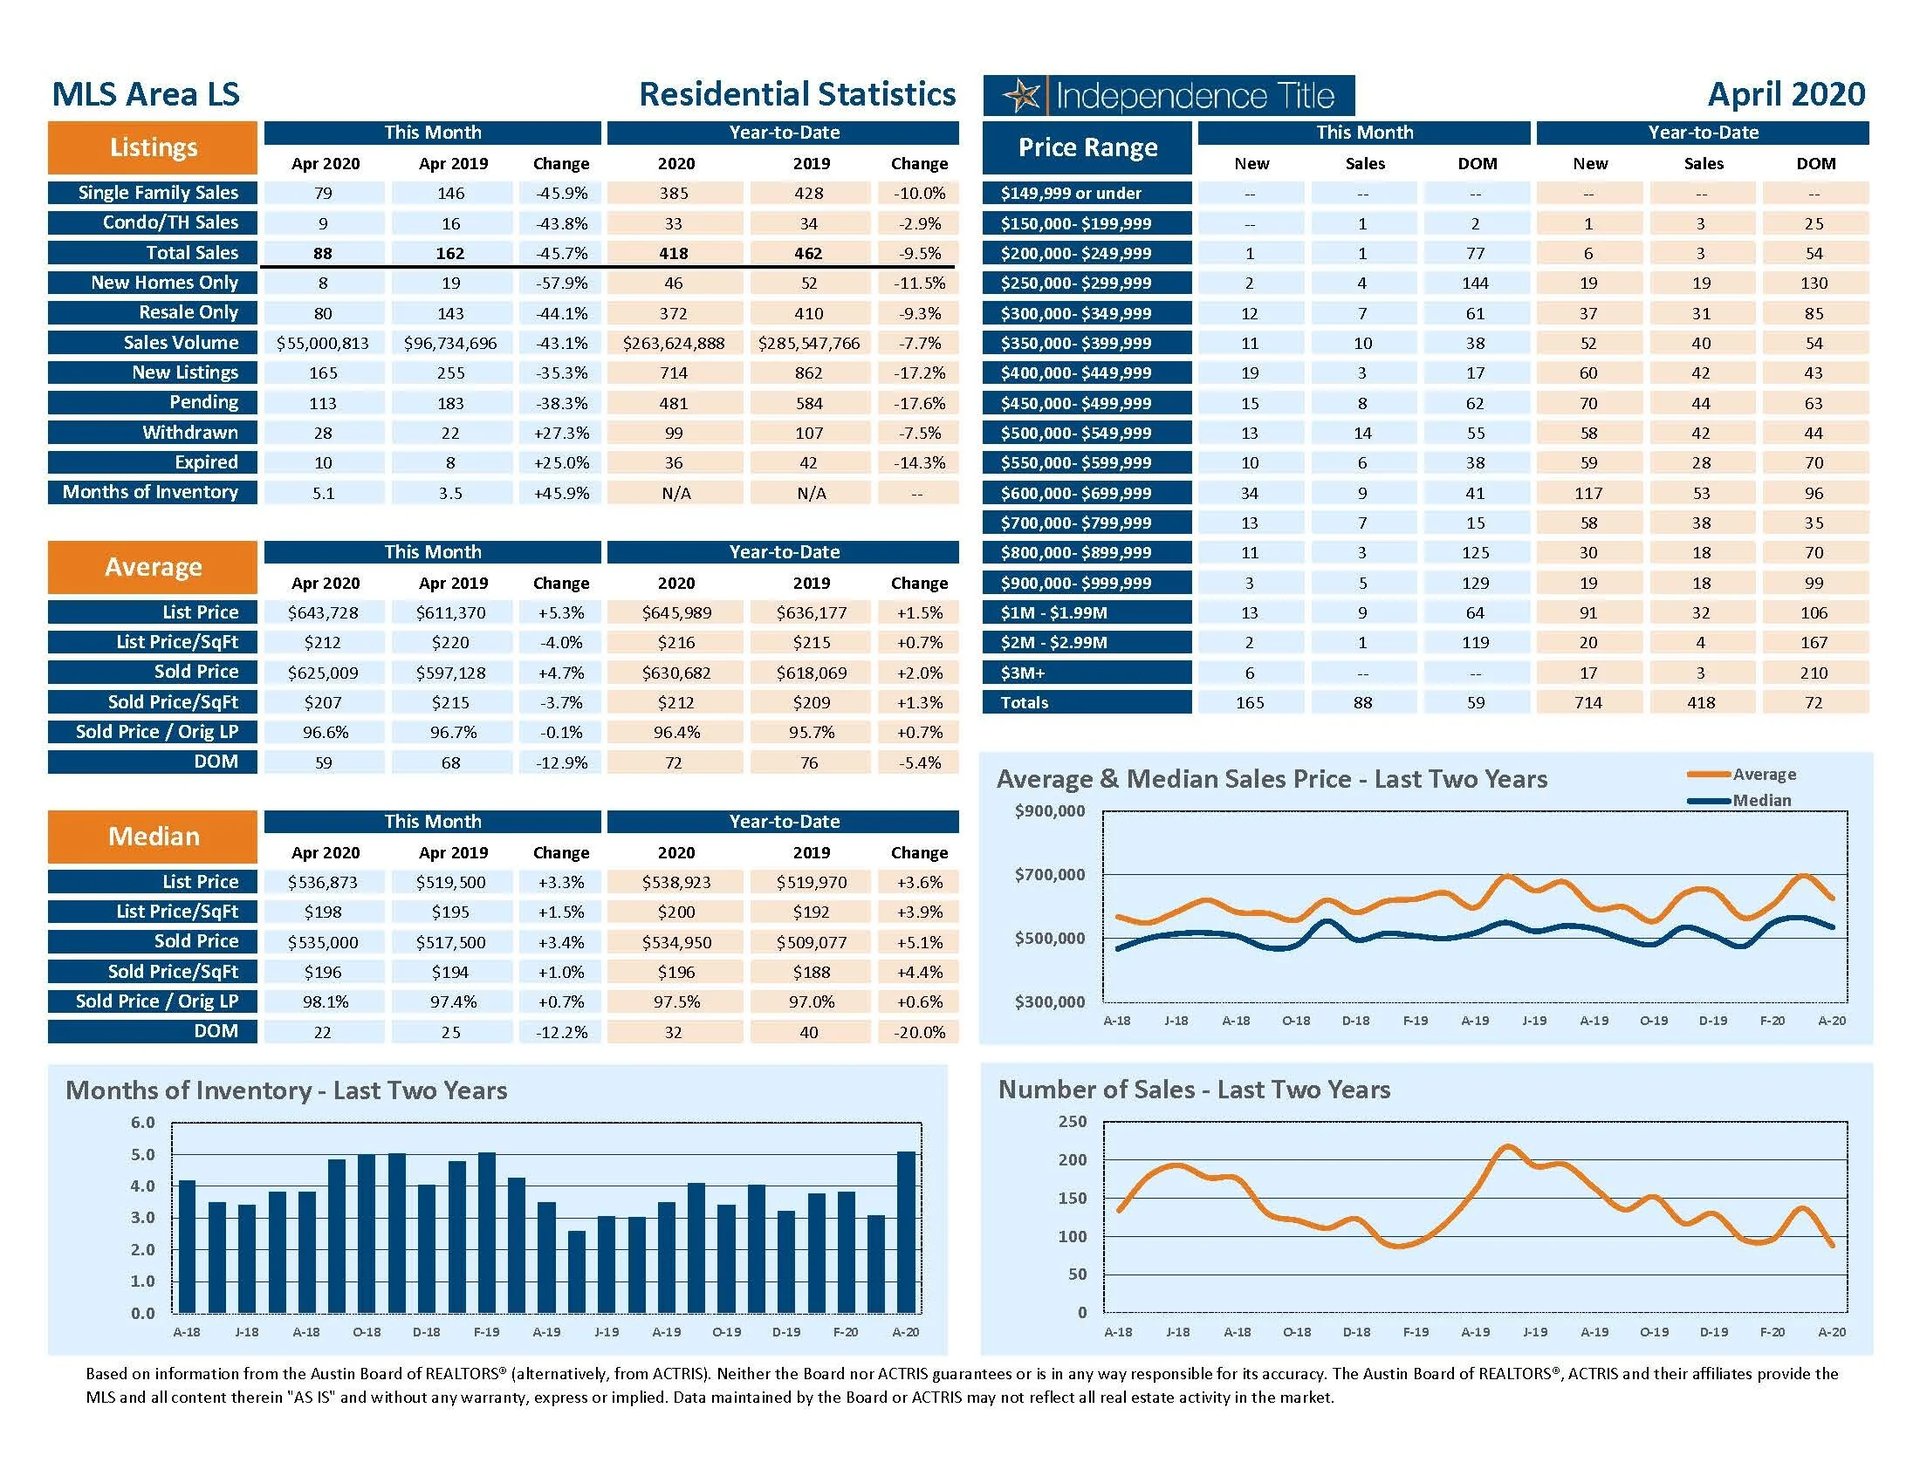
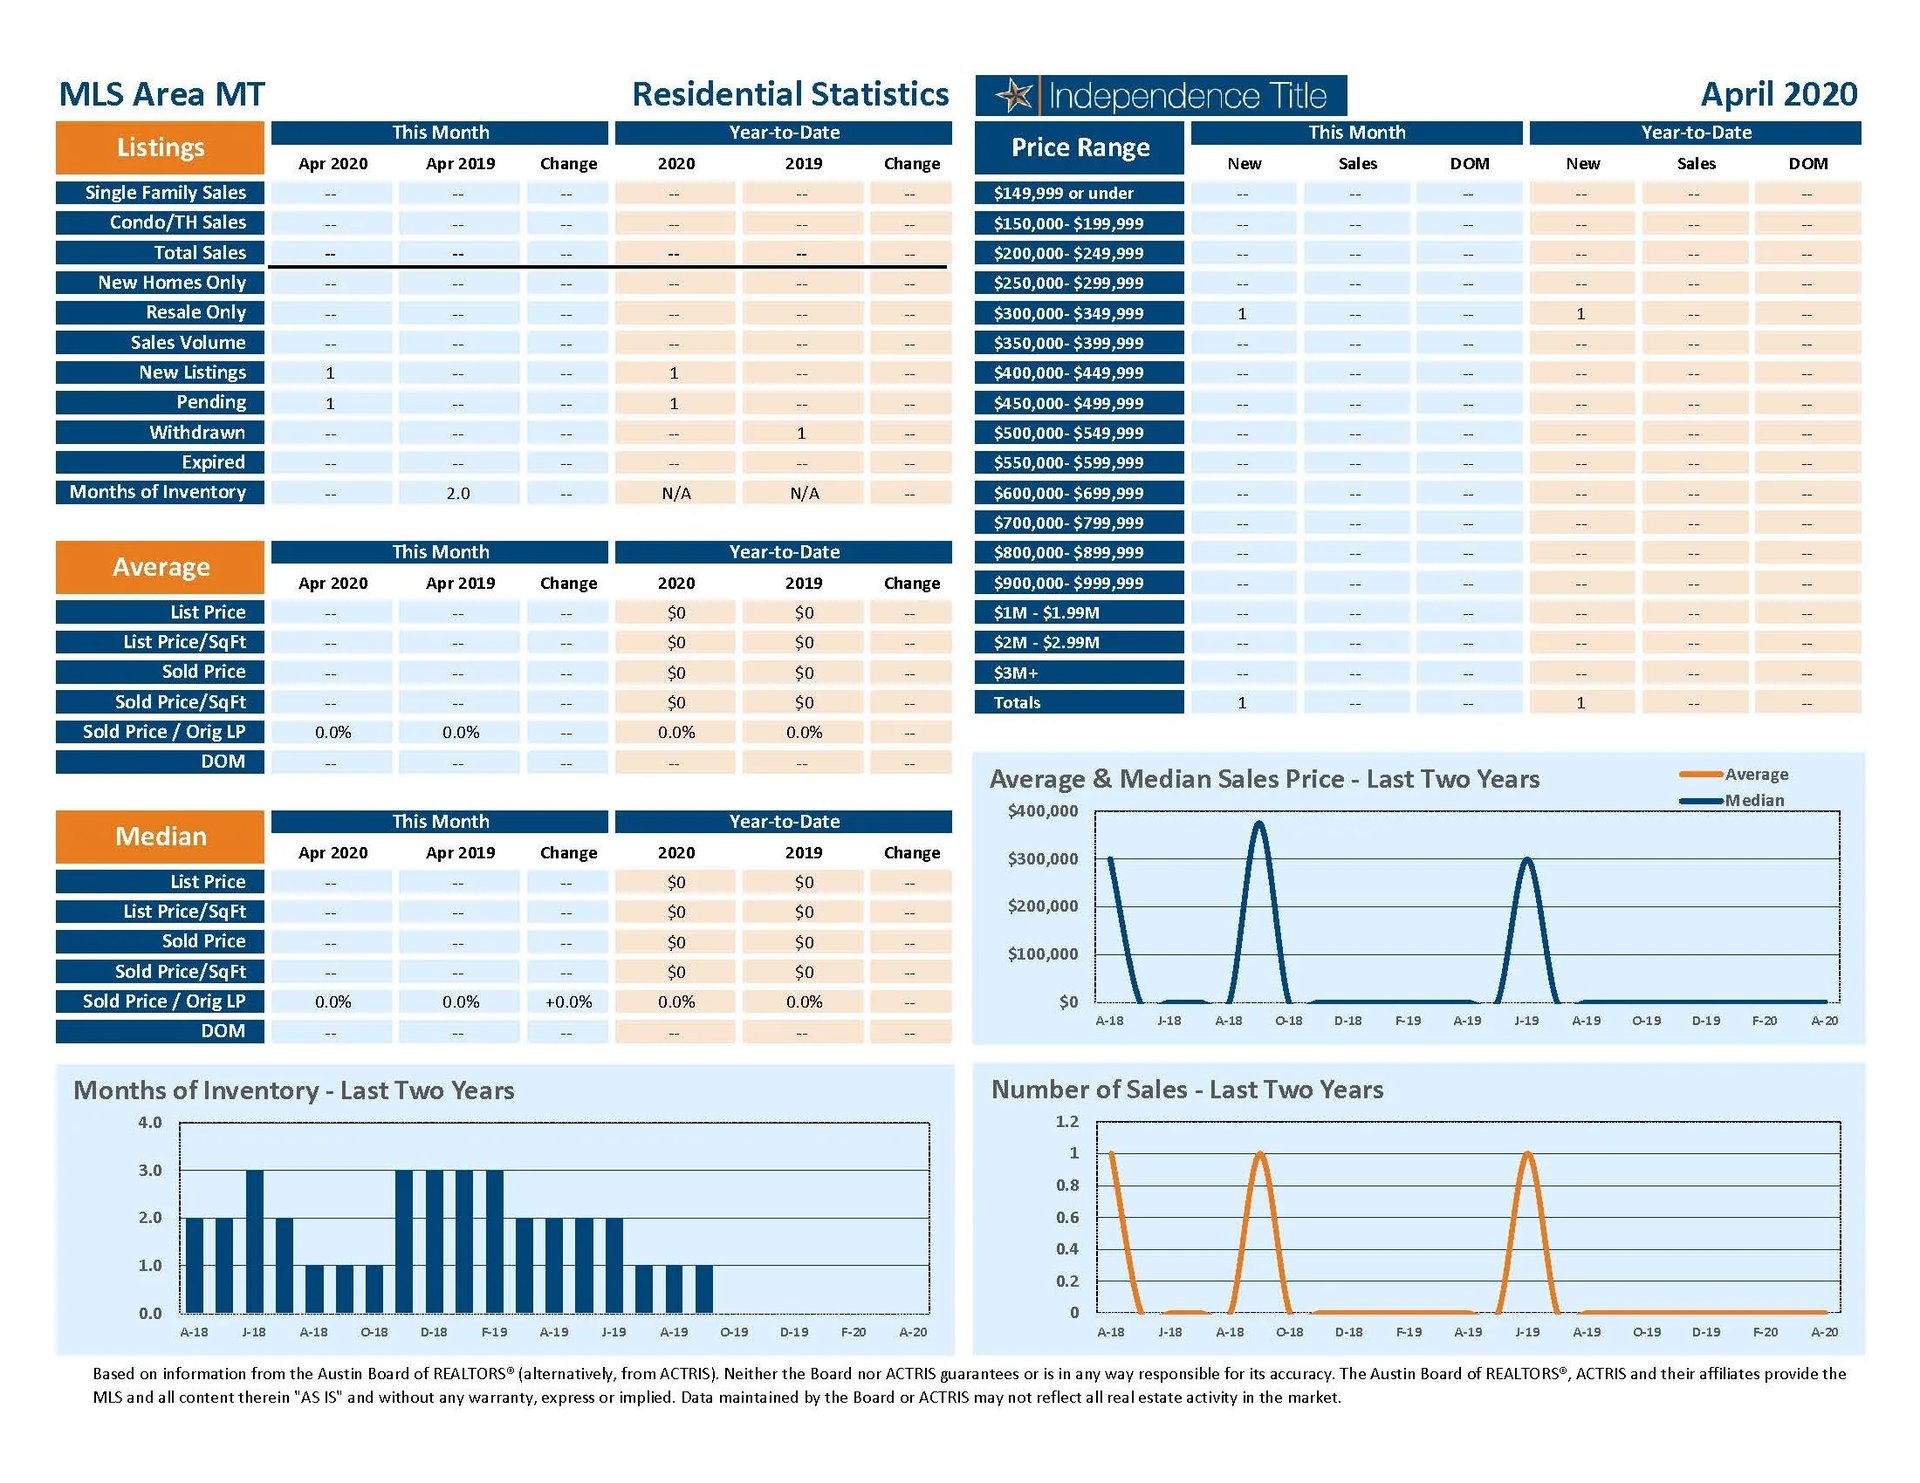
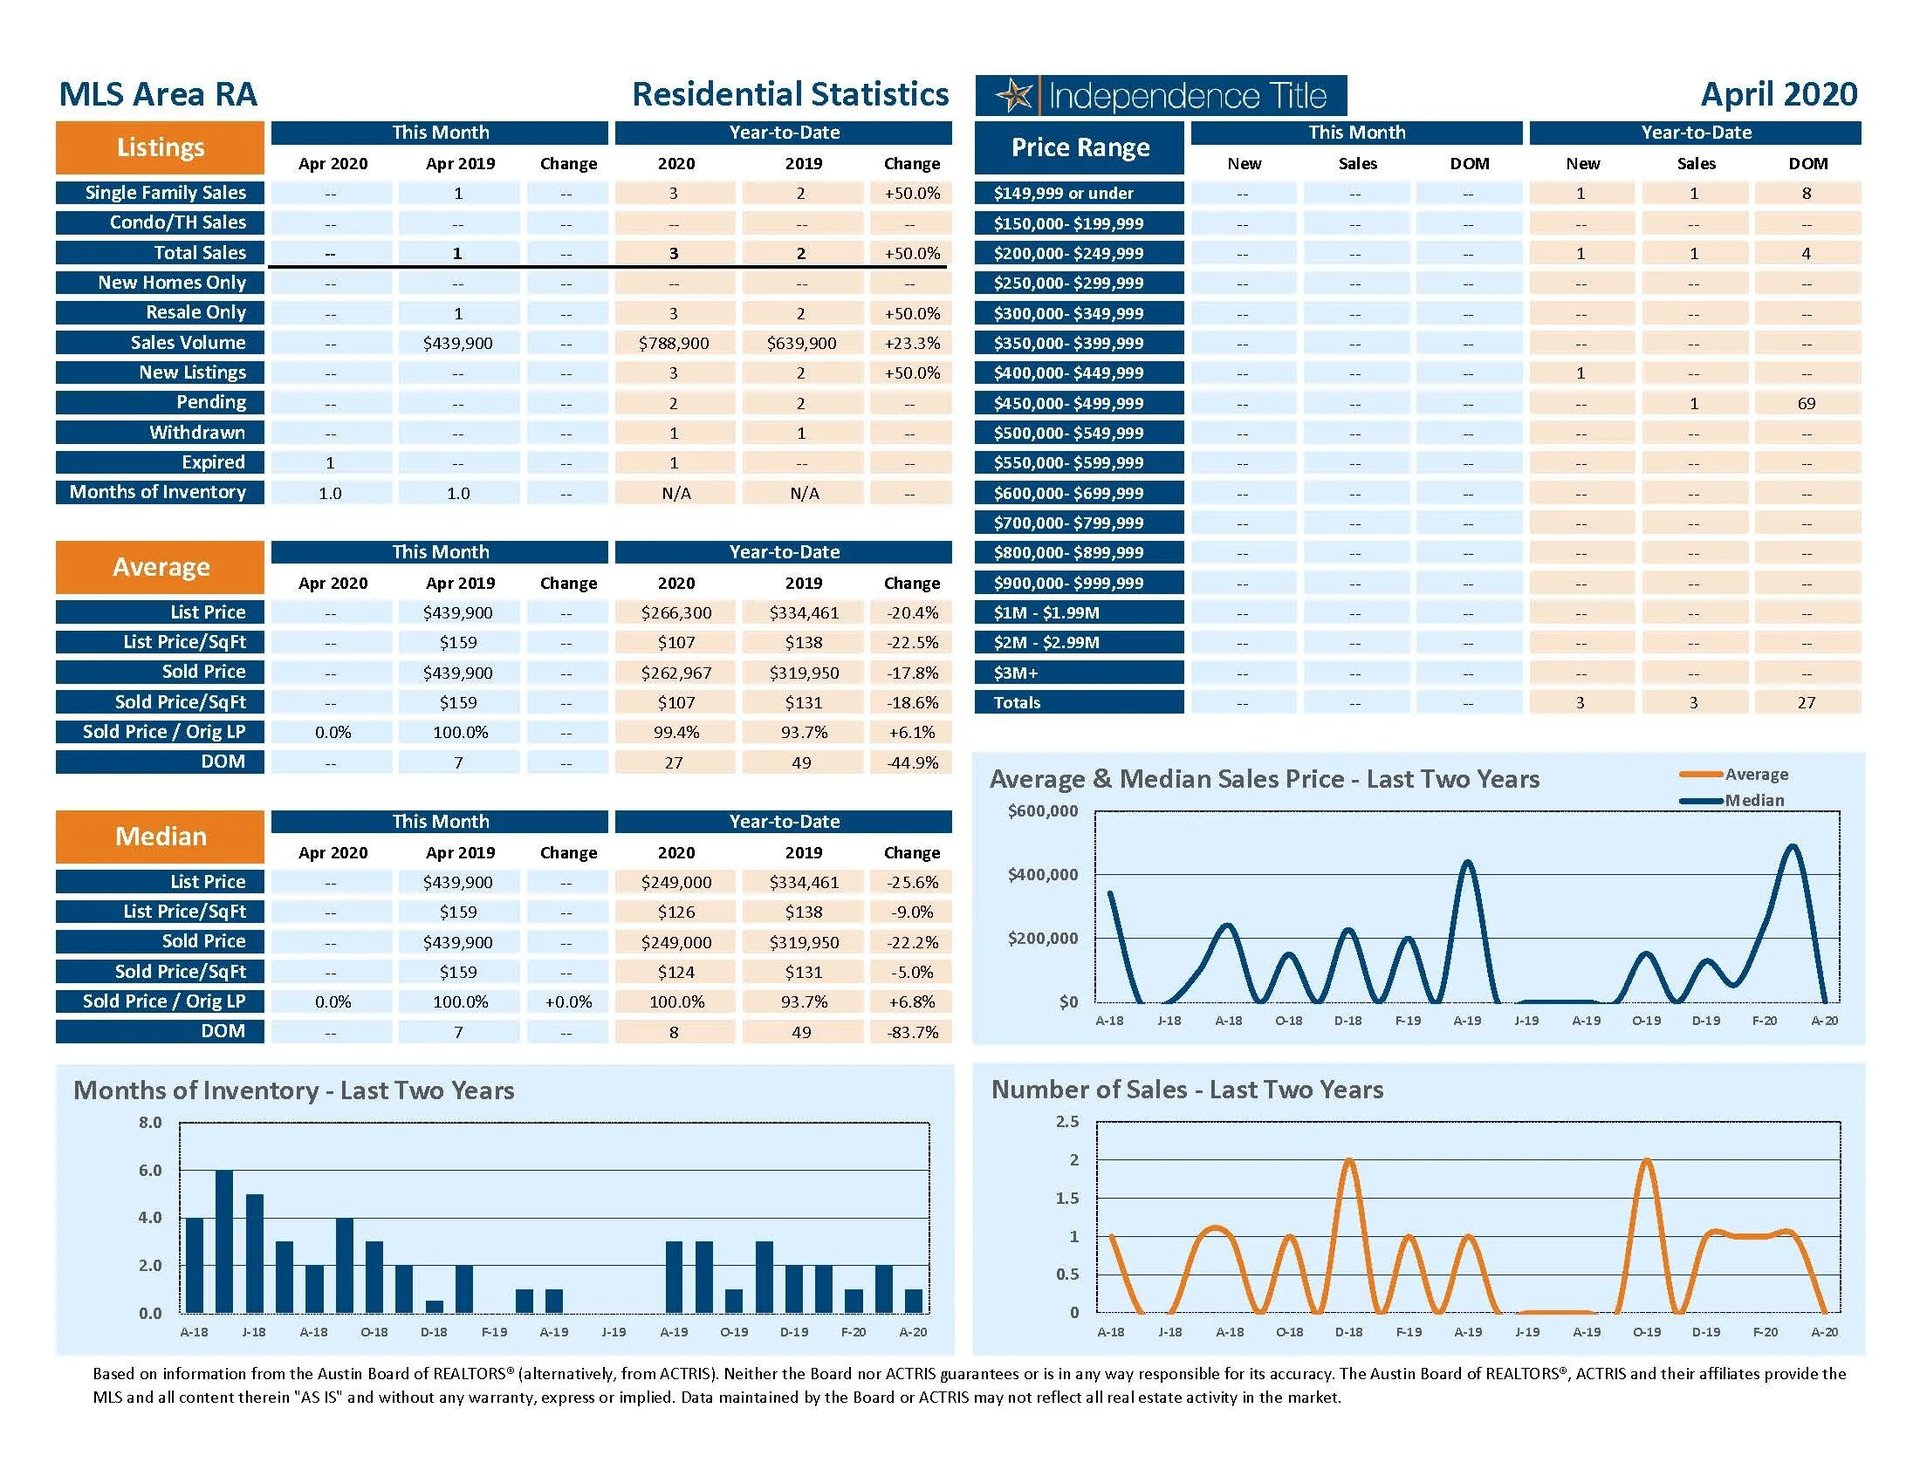
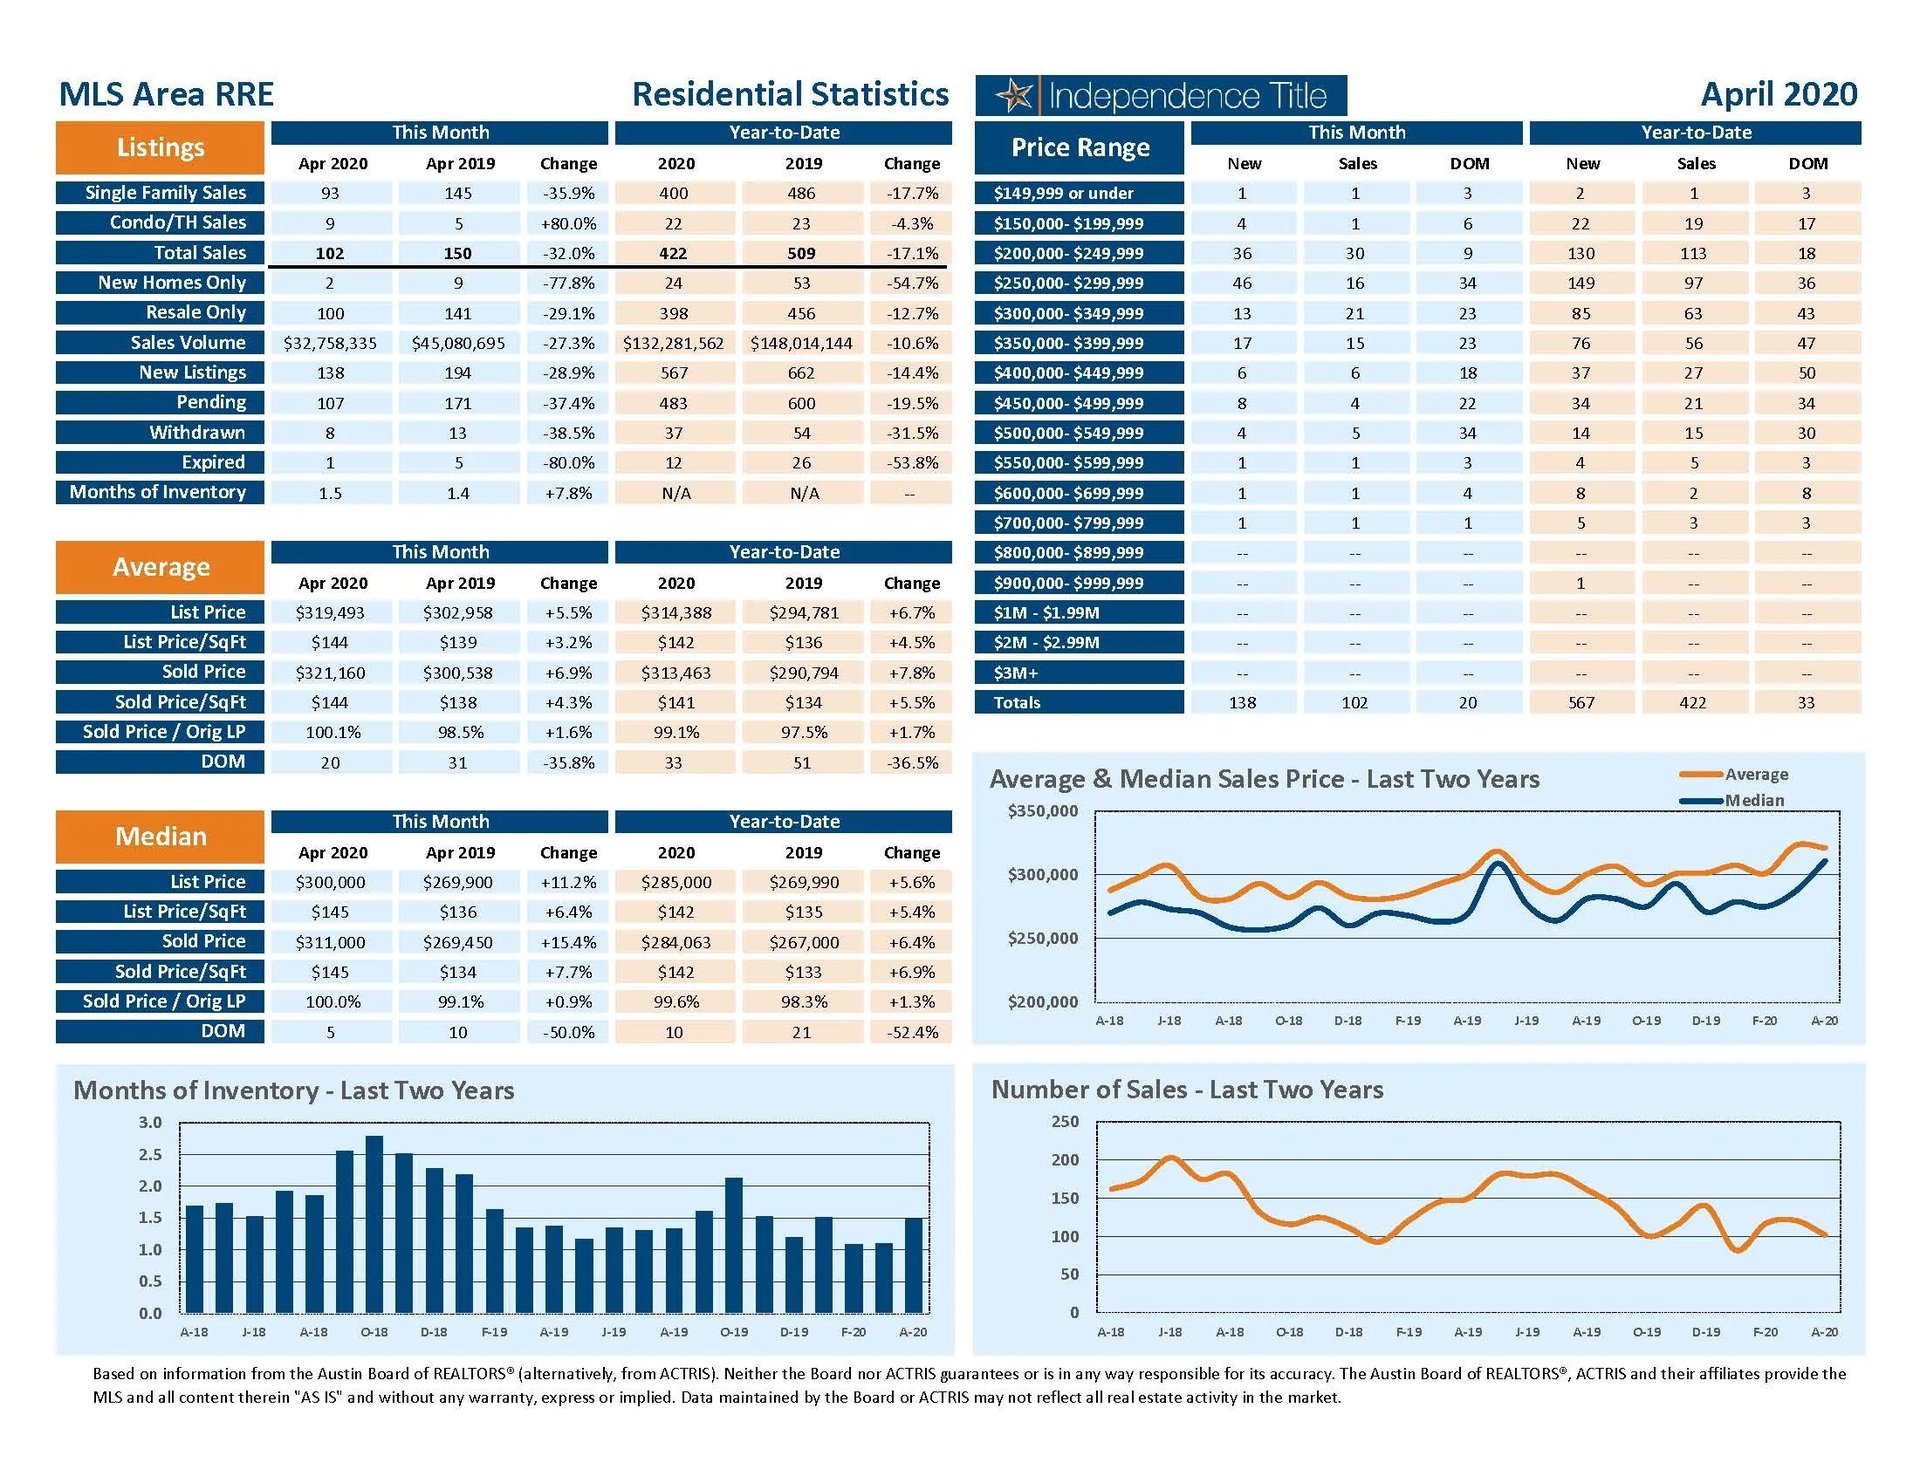
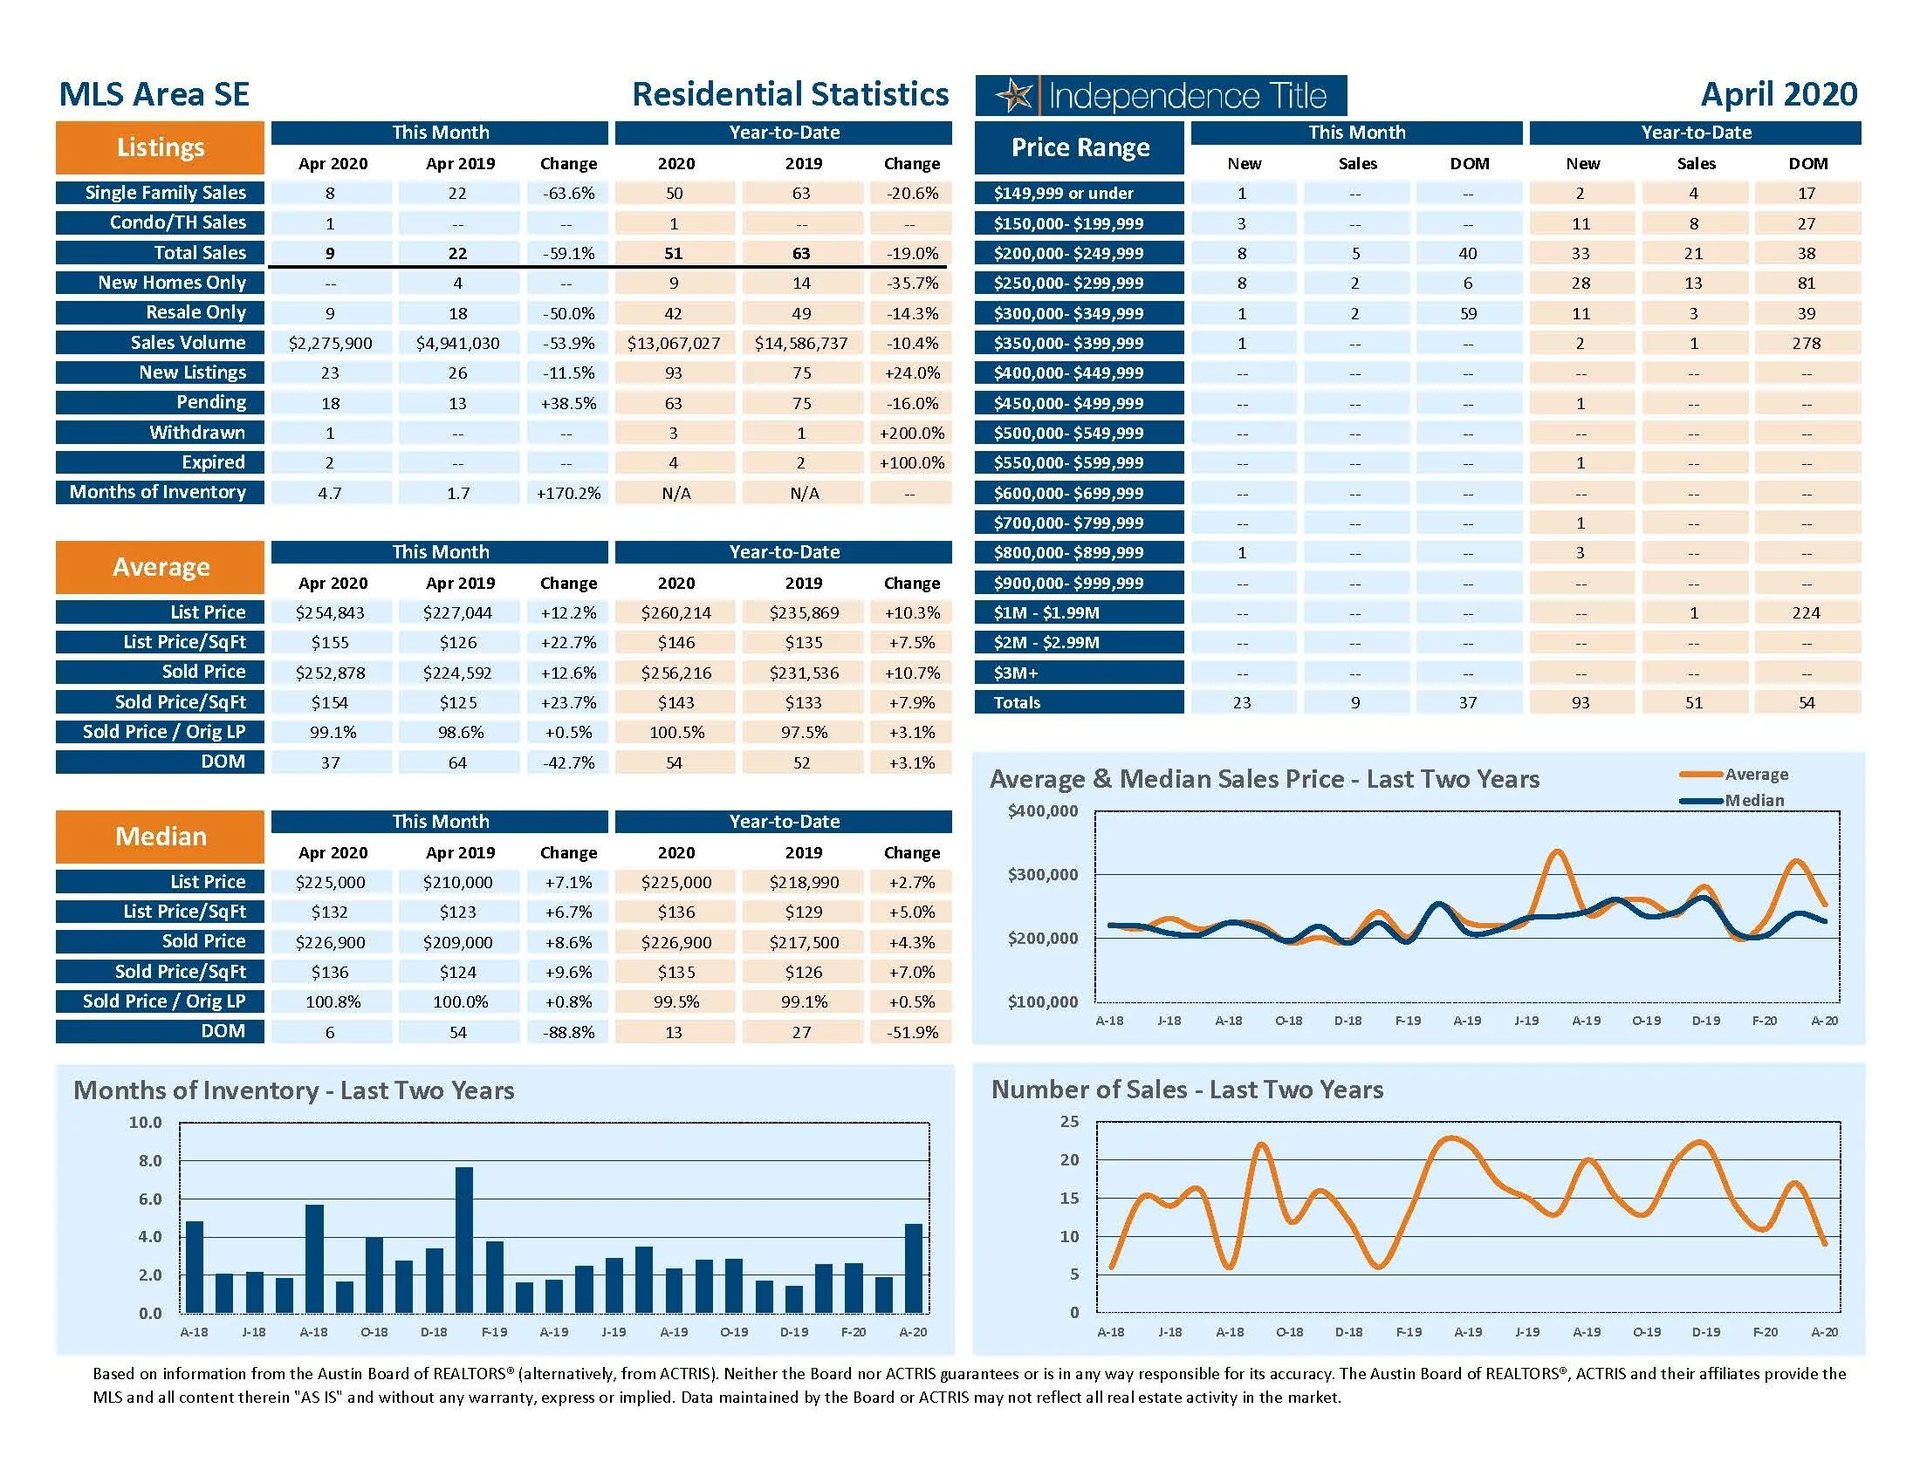
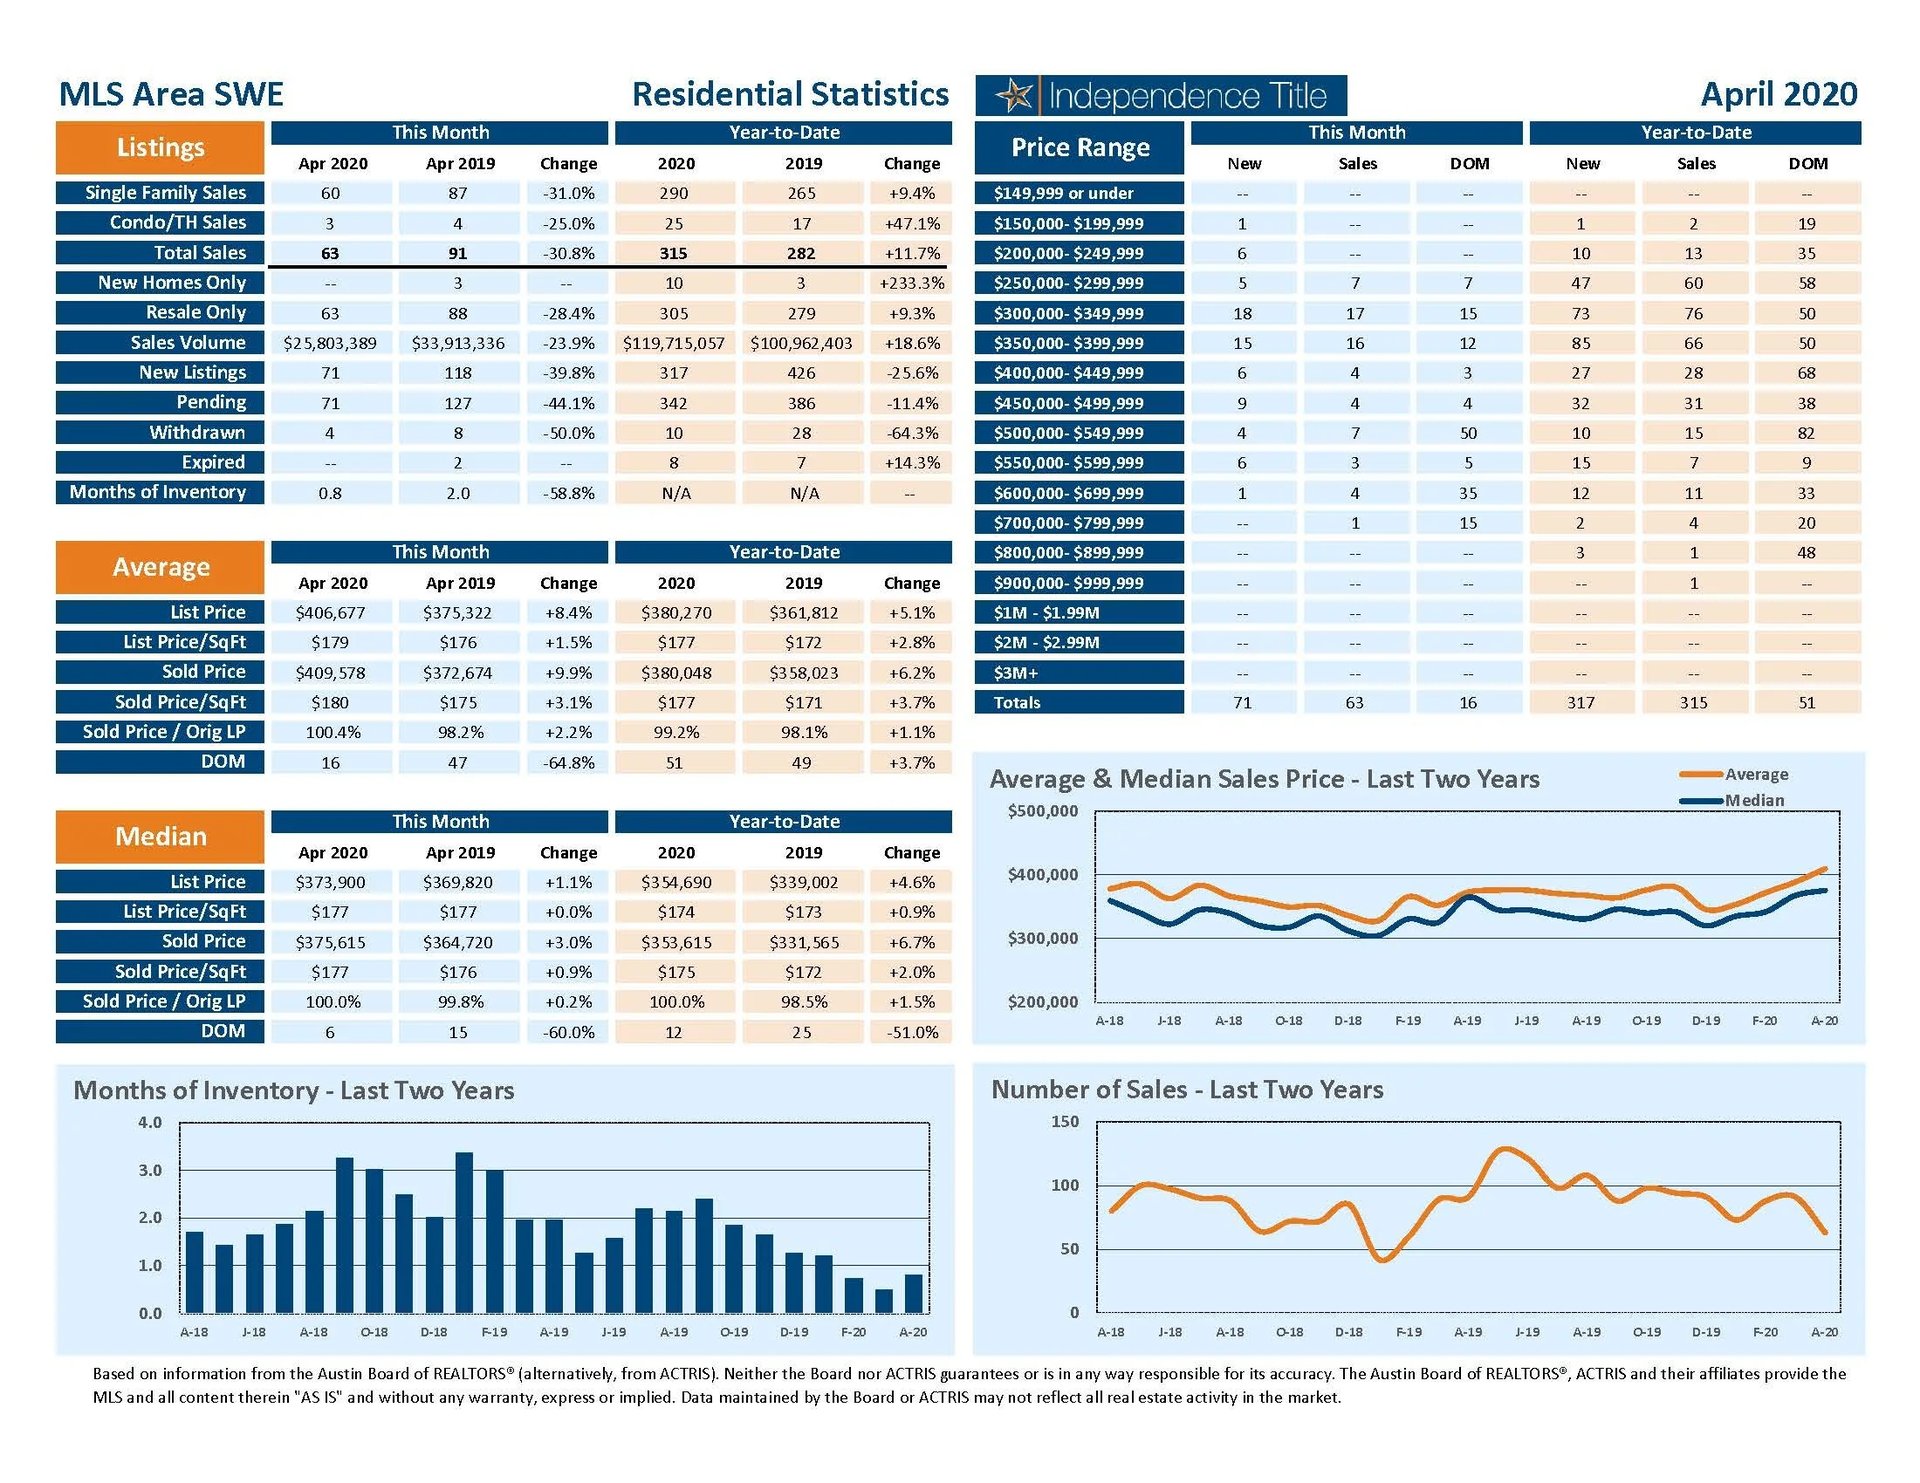
Median vs. Average
-
These statistics contain figures for both median and average, which are both useful for different purposes. The average simply means all the numbers are added together and divided by the total number. The median, on the other hand, is simply the middle number of a list of values.
-
In an odd-numbered list, the median is the middle number. In an even-numbered list, the median is the average of the two middle numbers. Example: 1,3,6,7,9 6 is the median. (The average is 5.2) Example: 1,3,4,6,8,9 The median is the average of 4 and 6, 4+6 / 2 = 5. (The average is 5.17)
- The median statistics can smooth out some of the large swings in trends often seen with averages. For example, if a few very expensive homes are sold in an otherwise middle-price-range neighborhood, the average price could go up quite a bit that month. But the median price probably won’t move much at all because it’s not affected by the larger numbers. This is especially true for smaller data sets where the ups and downs affect average pricing even more.
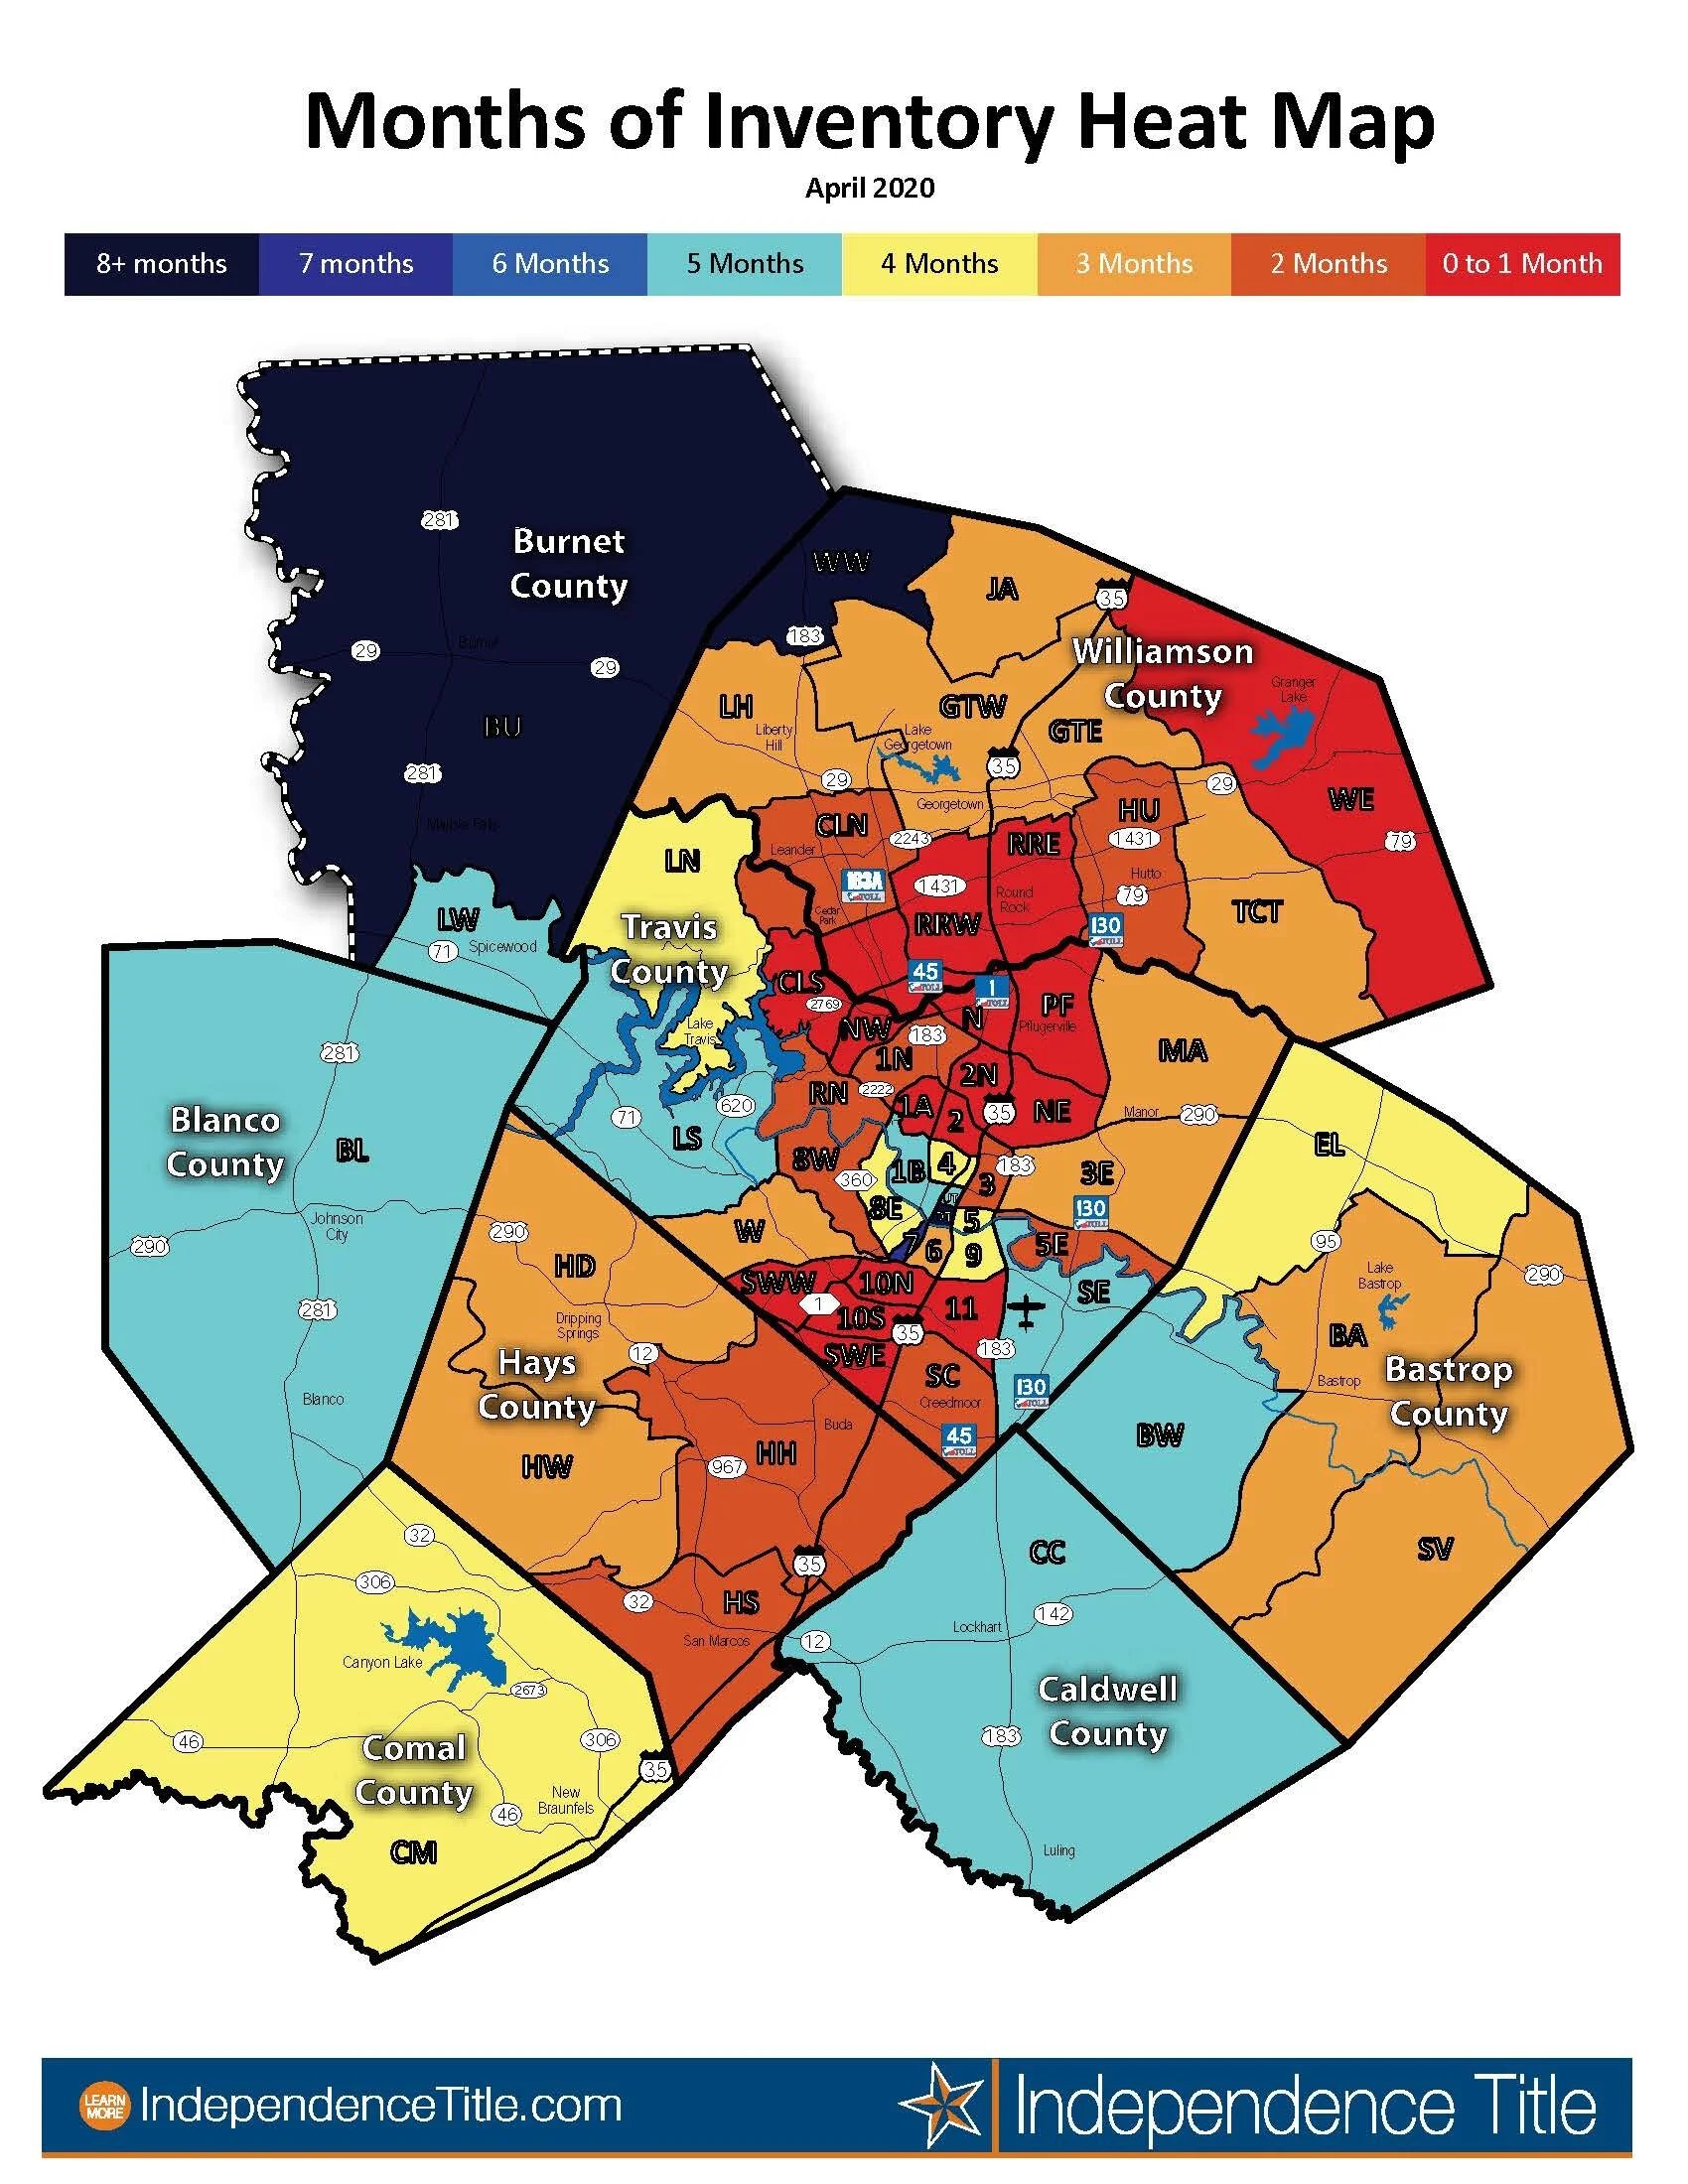
Months of Inventory
-
The months of inventory statistic answers the question: “If we kept selling the current active listings at the same rate we sold them in the previous month, how many months would it be until all the listings were sold?” For example, if there are 50 properties currently for sale in a certain area and last month there were 10 sales in that area, we can say the area has 5 months of inventory (50 active listings divided by 10 sold equals 5).
-
While there is no universal standard for calculating months of inventory, the most common way is to take a snapshot of the number of active listings on a certain day each month and use that as the figure for dividing. Independence Title uses the number of active listings on the 15th day of each month divided by the total sales for that month.
-
The months of inventory statistic is often used to determine if the local market is a seller’s or buyer’s market, and though it can be helpful for this purpose, it’s important to look at the recent trend over the past months to get the most accurate picture of inventory in your area. For example, four months of inventory would generally be considered a sign of a seller’s market, but if the trend line shows the figure rapidly increasing over the last several months, that could be an early sign of an oversupply. Conversely, a recent, significant decrease in months of inventory for a given area may be a sign that area is becoming “hot” for sellers, even if the current figure is higher than what would normally be considered a “seller’s market.”
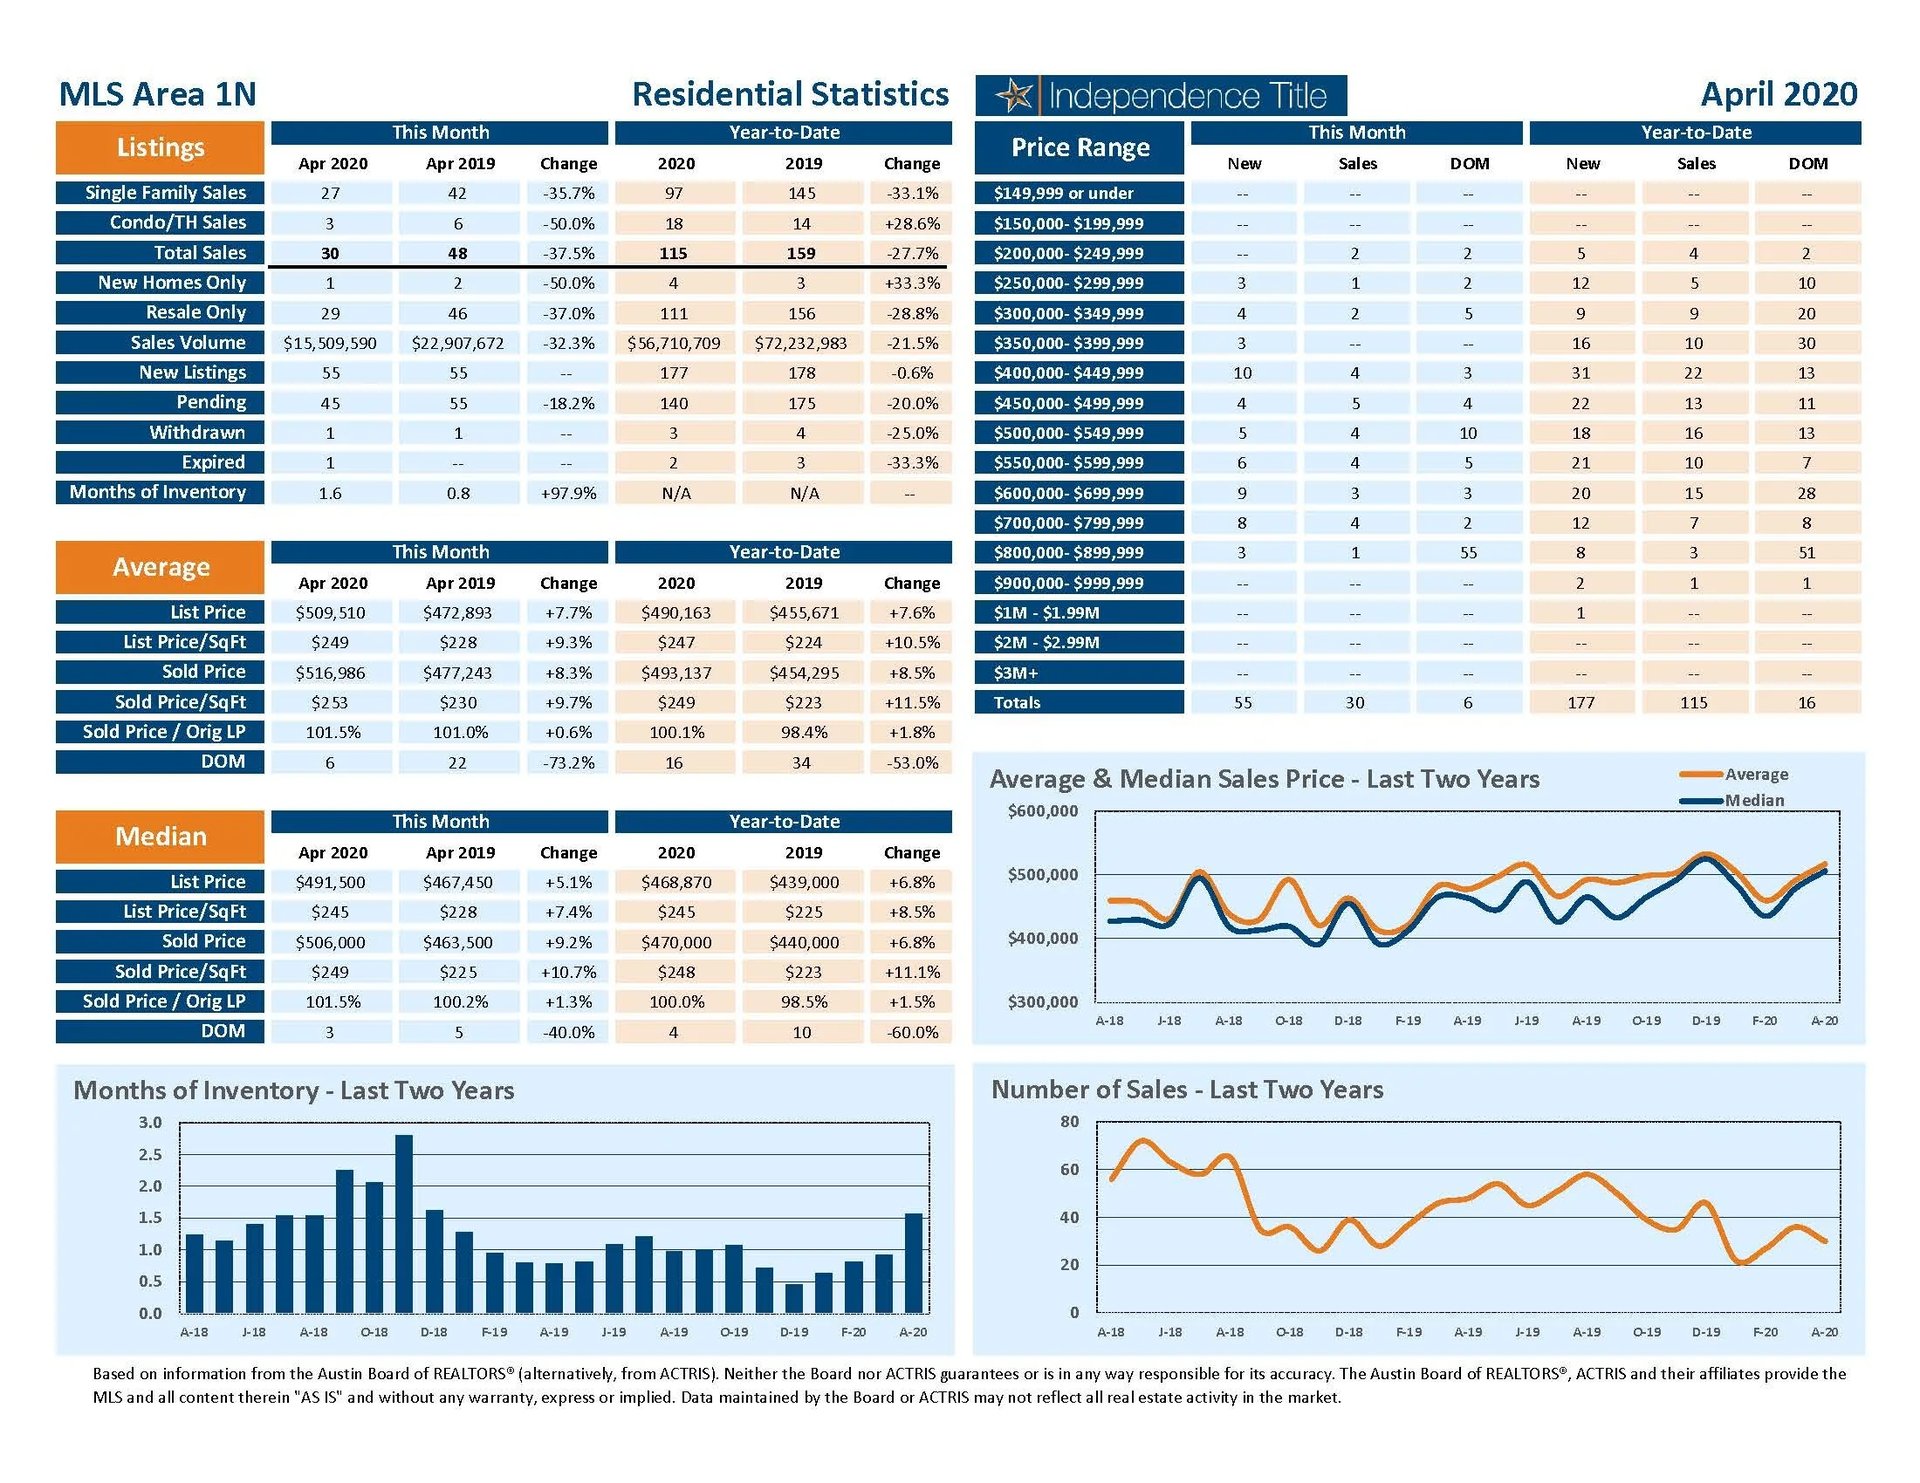
Sample Size
Zip Code Statistics vs MLS Areas